Whole-House Filter Pressure Drop Calculator — Clean vs Loaded
On this page
Calculate
This selector governs every field, label, result and export on this page, and it takes priority over the site header switch. Switching converts the values you entered rather than reinterpreting them, so 2.5 psi becomes 17.24 kPa and returns to exactly 2.5 psi when you switch back.
How many cartridge housings the water passes through in series. A typical whole-house train is a sediment stage followed by a carbon stage, so the sediment stage catches the particulate that would otherwise clog the more expensive carbon. Each stage carries its own clean drop, change-out rule, allowance and condition, and the drops add. Raising the count reveals the fields for the extra stages.
Stage 1
The drop across the first housing on a new cartridge, from the manufacturer flow chart or from your own gauge readings on the day it was fitted. This is the only required figure per stage and every other number on this page is built from it. Sizing practice keeps a new whole-house cartridge below about 2 to 3 psi, which is 13.8 to 20.7 kPa. A zero is rejected rather than accepted: a cartridge that costs no pressure is not filtering anything, and a blank field and a zero are different states here.
Cartridge instructions do not all state the trigger the same way, and the two forms give different answers on the same cartridge. The rise form replaces the cartridge when the drop has climbed by a stated amount above its clean baseline, which is the form most maintenance guidance uses. The absolute form replaces it when the total differential reaches a stated figure. On a 2.5 psi cartridge with a 10 psi figure the rise form gives 12.5 psi and the absolute form gives 10.0 psi, so the rule is an input rather than an assumption.
Under the rise rule this is the allowance added to the clean baseline; under the absolute rule it is the total differential at which the cartridge is replaced. Left blank, 10 psi is applied and the result says so. That is the upper end of the published 5 to 10 psi range, chosen because budgeting the optimistic end of a range is how a filtration allowance ends up short. It is taken per stage, because sediment and carbon cartridges carry different change-out guidance.
Used only for the current drop, which is what the train is producing today. New takes the clean drop, due for change takes the loaded figure, and part loaded takes the midpoint between them. It is ignored entirely when a measured drop is entered below, because a reading from the installation beats an assumption about it. Neither the clean total nor the loaded total depends on this field.
The difference between a gauge upstream of the housing and a gauge downstream of it, taken at a known flow with water running. It overrides the stage condition and unlocks the change-out assessment against the clean baseline. A reading below the clean drop is rejected: a cartridge collects sediment continuously and does not become less restrictive in service, so either the baseline or the reading is wrong, and the usual cause is two readings taken at different flows.
Where the clean figure came from. This changes confidence in the result rather than the result itself: it decides whether the calculator can tell you that your clean drop belongs to the flow you are designing for, and a figure with no confirmed basis marks the budget result preliminary.
The flow the chart figure was read at, or the flow your gauge reading was taken at. If it differs from the design flow the calculator says so and marks the budget preliminary. It never scales the drop, because cartridge curves differ by media type, micron rating, length and diameter and no multiplier converts a drop from one flow to another.
Supply and Budget (Optional)
The flow the filter train has to pass. A water supply fixture unit calculation is the usual source. It appears in no equation on this page and it changes no number: it exists only to establish whether the clean drop you entered has a matching flow basis, so it affects confidence in the result rather than the result itself.
The pressure still available upstream of the filter train while the system is passing its design flow, after the service line, the meter and any upstream device have taken their share. It unlocks the downstream figures and the share of supply. There is no static pressure field on this page: a cartridge produces no drop at zero flow, because its loss is friction through media rather than spring force.
The pressure the budget allows the filtration line, if one has been assigned. The test is run against the fully loaded total and never against the clean one, because the system has to work on the day before a cartridge change. Where the clean total is inside the allowance and the loaded total is not, the result says exactly that.
Overview
A cartridge filter is the one device in a plumbing pressure budget whose loss grows with time in service. A water meter loses pressure by a stable relationship with flow and gives the same number next year as it does today. A backflow assembly holds a fixed floor set by its check springs. A cartridge collects sediment, iron and scale continuously, which progressively closes off the open area available to flow, so its drop climbs from the day it is fitted until the day it is replaced.
That is why one number cannot describe it, and why this page returns three. The clean drop is the baseline and the figure the cartridge was selected against. The loaded drop is what it produces on the day it is due for replacement, and it is the figure a pressure budget has to survive. Between them sits the current drop, which is what the house is feeling today and the figure that matters when someone is troubleshooting a complaint rather than designing a system.
What to Look at First
The loaded total, not the clean one. The clean figure is what the specification sheet publishes and what most pressure budgets carry, and it describes exactly one day in the life of the cartridge. The number the system has to survive is the drop on the day the cartridge is due for changing, which is several times larger. Read the fully loaded total first and carry that one into the budget.
Whether the budget passes clean and fails loaded. This is the single most common way the page changes a decision. A 5 psi filtration allowance clears a 2.5 psi clean drop comfortably and fails a 12.5 psi loaded drop badly, so a calculation tested against the clean figure reports a pass and the system works perfectly for the first few weeks. Where that happens the result says so explicitly.
Which stage figures were measured and which were assumed. The current total is the only one of the three that depends on the present state of the cartridges. Where you entered a gauge reading it is used directly and the result names that stage; where you did not, the figure came from the condition you selected, and it is a guess about a cartridge where two gauges would be a fact about it.
Whether the flow basis matches. The design flow changes no number on this page. It only tells you whether the clean drop you entered belongs to the duty you are designing for, and where it does not, the budget result is marked preliminary rather than being scaled by a multiplier with nothing behind it.
How to Use This Calculator
Choose the unit system with the calculator's own selector. Every field, label, result and export follows that selector, and switching it converts the values you already entered rather than reinterpreting them.
Enter the number of cartridge stages, from one to four. A typical whole-house train is a sediment stage followed by a carbon stage, and raising the count reveals the fields for the extra stages.
Enter the clean pressure drop for each stage. Take it from the manufacturer flow chart for the cartridge, or from your own gauge readings on a new cartridge. Good practice keeps this below about 2 to 3 psi on a new cartridge, and it is the only required figure per stage.
Say where that figure came from and at what flow. If you enter a design flow that differs from the flow the clean drop was stated at, the calculator will say so and mark the result preliminary rather than scaling the number for you.
Choose the change-out rule for each stage. Most guidance expresses the trigger as a rise above the clean baseline, commonly 5 to 10 psi. Some cartridge instructions instead give an absolute differential at which the cartridge is replaced. The two give different answers, so pick the one your cartridge actually uses.
Say what state each stage is in, or better, enter a measured drop from gauges either side of the housing. A measurement always beats an estimate, and the result will tell you which stages were measured and which were assumed.
Enter the flowing supply pressure at design flow if you want the downstream figures and the share of supply. Enter an allowable loss if the pressure budget assigns one to filtration.
Read the three totals. The loaded figure is the one to carry into the pressure budget. The current figure is the one that matters when you are troubleshooting a complaint about pressure today.
Only the stage count and the clean drop for each stage are required, and no optional field blocks the Calculate button. Blank and zero are treated as different states throughout: a blank change-out figure takes the 10 psi default and the result says so, while a clean drop entered as zero is rejected, because a cartridge that costs no pressure at all is not filtering anything.
Inputs & Outputs
Inputs
Outputs
Whole-House Filter Pressure Drop Formula
The arithmetic is simple. What matters is which number goes into which question, and the answer is the loaded one for every judgement the page makes.
INPUTS
- stage_count: number of cartridge housings in series, 1 to 4. Required.
- clean_drop: the drop across a stage on a new cartridge. Required, per stage.
- rule: rise above the clean baseline, or absolute total drop. Per stage.
- allowance: the rise allowed, or the absolute figure. Per stage, default 10 psi.
- condition: new, part loaded, or due for change. Per stage.
- measured_drop: gauge reading either side of the housing. Optional, per stage.
- basis and stated_flow: where the clean drop came from. Optional, per stage.
- design_flow: checks the flow basis only. It enters no equation.
- supply_flowing: pressure upstream of the train at design flow. Optional.
- allowable_loss: the budget assigned to filtration. Optional.
Clean Total
clean_total = sum of clean_drop across all stages
The best case, on the day the cartridges are fitted. This is the figure most people put into a pressure budget, and it is the wrong one.
Loaded Per Stage, Rise Rule
loaded_stage = clean_drop + allowance
The common form. A 2.5 psi cartridge with a 10 psi allowance is due for change at 12.5 psi.
Loaded Per Stage, Absolute Rule
loaded_stage = the stated absolute figure
Some cartridge instructions give the trigger as a total differential instead. The same cartridge with a 10 psi absolute figure is due at 10.0 psi, not 12.5.
Loaded Total
loaded_total = sum of loaded_stage across all stages
The figure the pressure budget has to survive, because the system runs at this drop on the day before a change.
Current Per Stage
current_stage = measured_drop where a measurement is entered
current_stage = clean_drop where the stage is new
current_stage = clean_drop plus half the span where part loaded
current_stage = loaded_stage where the stage is due for change
The span is the distance between the clean drop and the loaded drop for that stage. A measurement always overrides an estimate.
Change-Out Assessment
rise = measured_drop - clean_drop
The rise is read against the span between clean and loaded. At or below a quarter of it reads clean, above three quarters reads approaching, and at or above the whole span the cartridge is due. Those bands give a reading a shape and are not published thresholds.
Downstream Pressure at Design Flow
p_down = supply_flowing - the total for that case
Calculated for the clean, current and loaded totals. There is no static case: at zero flow a cartridge has no pressure drop at all, because its loss is friction through media rather than a spring.
Share of Supply
share = loaded_total / supply_flowing
At or below 15 percent is modest, above that to 30 percent is significant, above 30 percent is dominant. These are screening labels rather than code limits, and the share is computed on the loaded total.
Budget Test
budget test compares loaded_total against allowable_loss
Never the clean total. A budget tested against the clean figure passes on paper and fails in service some months later.
Unit Conversions
kPa = psi multiplied by 6.895
L/min = GPM multiplied by 3.785411784
feet of head = psi multiplied by 2.31
Cartridge dimensions stay in inches in both unit systems, because that is how housings and cartridges are sold and specified.
Clean vs Loaded Filter Pressure Drop
Two numbers describe the same cartridge and they are used for different things. Confusing them is the most common error on this subject, and it is the reason this page exists.
The clean drop is what the cartridge produces on the day it is fitted. It is the figure on the manufacturer flow chart, the figure a cartridge is selected against, and good practice keeps it under about 2 to 3 psi for a new cartridge on a whole-house system. It is also the lowest drop that cartridge will ever produce, because from the moment water starts passing through it the media begins collecting sediment and closing off the open area available to flow.
The loaded drop is what the cartridge produces on the day it is due for replacement. Common guidance puts that at 5 to 10 psi above the clean baseline, so a cartridge chosen at 2.5 psi is running somewhere between 7.5 and 12.5 psi at the end of its interval. That is up to five times the number it was selected on.
Between them sits the current drop, which is what the system is producing today. On a cartridge halfway through its life it is somewhere in the middle, and the only reliable way to know it is to measure it.
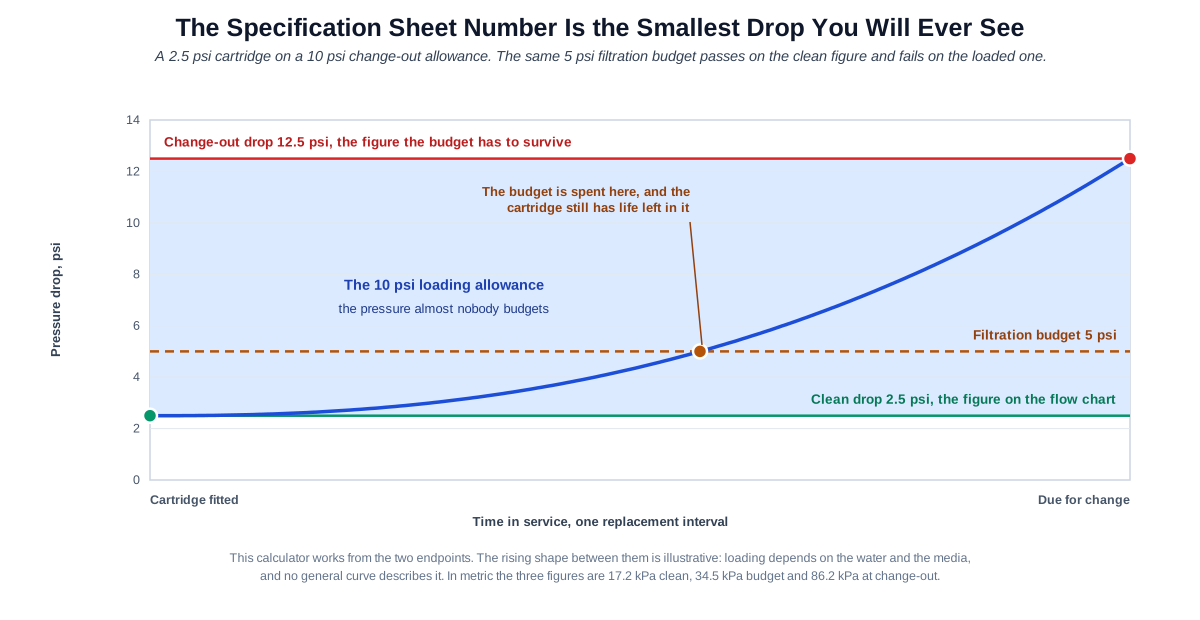
Which number you want depends on the question. Sizing a system or building a pressure budget takes the loaded figure, because the design has to work on the day before the change rather than only on the day after the install. Troubleshooting a pressure complaint takes the current figure, because that is what the house is feeling. The clean figure is the baseline the other two are measured against, and on its own it describes exactly one day in the cartridge's life.
How to Measure Filter Pressure Drop
Pressure drop across a filter is a difference between two readings, so it needs two gauges: one upstream of the housing and one downstream of it. Subtract the downstream reading from the upstream one and that is the drop.
The reading only means something at a known flow, because the drop rises with flow. Take it with a fixture or two running rather than with the house idle, and note what was running so the next reading can be taken the same way. A drop measured with nothing flowing will read close to zero regardless of how loaded the cartridge is, because a cartridge only costs pressure when water is moving through it.
Record the clean baseline on the day you fit a new cartridge. Without that number the later readings have nothing to be compared against, and the change-out decision falls back to the calendar. Many manufacturers provide a space on the installation paperwork for exactly this, with a line for the starting pressure and a line for the pressure at which the cartridge should be serviced.
After that, the assessment is simple arithmetic: the current drop minus the clean baseline is the rise, and the rise against the change-out criterion tells you where the cartridge stands. A rise of a couple of psi on a 10 psi allowance means the cartridge is barely loaded. A rise approaching the full allowance means it is due.
A measurement always beats an estimate. This calculator will estimate a current drop from a description of how loaded a stage is, and the estimate is useful when there are no gauges, but the estimate is a guess about a cartridge and the gauges are a fact about it. Where both exist the result uses the measurement and says so.
Change-Out Drop, Rise Versus Absolute Differential
Cartridge instructions do not all state the change-out trigger the same way, and the two common forms give different answers on the same cartridge.
The rise form says to replace the cartridge when the drop across it has increased by a stated amount above its clean baseline, commonly 5 to 10 psi. It is the form most maintenance guidance uses, and it is the form manufacturers assume when they provide a place on the paperwork to record the starting pressure and then the service pressure. It requires a clean baseline to be recorded, which is why that habit matters.
The absolute form says to replace the cartridge when the total differential across it reaches a stated figure. It requires no baseline, which makes it simpler to follow, but it makes an assumption about what the clean drop was.
Take a cartridge with a clean drop of 2.5 psi and a 10 psi figure. Under the rise form it is due for change at 12.5 psi. Under the absolute form it is due at 10.0 psi. That is 2.5 psi of difference from wording alone, and the direction matters: applying the rise rule to a cartridge specified absolutely overstates the pressure budget, while applying the absolute rule to one specified as a rise understates it and leaves the cartridge in service past its intended point.
So the rule is an input on this page rather than an assumption. Check the cartridge documentation for which form it uses before deciding what the loaded figure is.
Multi-Stage Filter Pressure Drop
A whole-house train is rarely one cartridge. The usual arrangement puts a sediment stage first and a carbon stage behind it, so the sediment stage catches the particulate that would otherwise clog the more expensive carbon. Each stage has its own clean drop, its own change-out criterion and its own loading rate, and the drops add.
The arithmetic is straightforward and the result is often surprising. A sediment stage at 2.5 psi and a carbon stage at 3.0 psi total 5.5 psi clean, which is 37.9 kPa and looks like nothing at all. Load both to their change-out point on a 10 psi allowance and the total reaches 25.5 psi, which is 175.8 kPa. On a 50 psi supply that is just over half of everything the house has, before a single foot of pipe, the meter, the elevation or any other device has been counted.
The stages will not usually be in the same condition. A sediment stage protecting a carbon stage loads faster than the stage behind it, and the two may be on different replacement intervals, so the realistic case is often one cartridge near the end of its life while another is partway through. With the sediment stage due and the carbon stage recently replaced, the current total is 15.5 psi, which is neither the clean figure nor the fully loaded one and is what the house is actually feeling.
The allowances can differ between stages too. A sediment stage on a 10 psi allowance alongside a carbon stage on a 5 psi allowance gives a loaded total of 20.5 psi rather than 25.5, so the calculator takes the allowance per stage rather than applying one figure to the whole train.
Why the Calculator Does Not Scale by Flow
Pressure drop through a cartridge rises with flow. That much is certain. What is not available is a single relationship that describes how, across the range of cartridges people actually install.
Two of the neighbouring pages in this cluster do model flow. The water meter page uses a square law, because meter loss follows one closely across the published data for that device class. The backflow preventer page uses a floor plus a square root term, fitted to published datasets for reduced pressure and double check assemblies. Both models earned their place by reproducing real data for devices that behave consistently.
Cartridges do not behave consistently. A pleated cartridge, a melt blown cartridge and a carbon block of the same nominal size and the same micron rating have different curves, and changing the length, the diameter or the rating changes the curve again. Manufacturers publish a drop against flow curve for each cartridge precisely because no general rule covers them.
So this page takes the clean drop at the flow it was stated at and works the budget from there. If the design flow differs from the stated flow, the result says so and is marked preliminary rather than being scaled by a multiplier that has nothing behind it. That is less convenient than a number, and it is the honest answer: for a decision that matters, get the manufacturer curve at the flow you are designing for.
The design flow is still worth entering, because it is what allows the calculator to tell you whether the figure you have has a matching basis. It affects confidence in the result rather than the result itself.
Bigger Housing Versus Coarser Micron
When the loaded drop is higher than the system can carry there are two directions to go, and they are not equivalent.
The size lever comes first. A 20 inch cartridge passes roughly twice the flow of a 10 inch cartridge of the same filtration technology at the same pressure drop, so doubling the length is the single most direct way to cut the drop without changing what the filter catches. The 4.5 inch diameter housing, sold as Big Blue, exists for exactly this reason: it carries whole-house flow rates where the slim 2.5 inch housings, which are point of use devices, cannot. Fitting a whole-house system with slim housings is a common cause of an unexpected drop.
Media construction is the second lever. A pleated cartridge presents considerably more surface area than a spun or melt blown cartridge of the same dimensions, so it offers less resistance at the same micron rating. Gradient density media holds more dirt before the drop starts climbing, which lengthens the interval rather than lowering the starting figure.
The micron lever comes last, and it is a trade rather than a fix. A 20 micron cartridge restricts far less than a 5 micron, which restricts far less than a 1 micron, so going coarser does reduce the drop. It also stops catching the particles between the old rating and the new one. If the filter was installed to solve a specific problem, opening up the rating gives back part of that problem in exchange for the pressure.
So the order is length, then diameter, then media construction, then rating. The first three preserve the filtration you paid for, and only the last one spends it.
What Is Filter Pressure Drop
Water passing through filter media has to be pushed through it, and the pressure it takes to do that is lost to the rest of the system. That loss is the pressure drop across the filter, measured as the difference between a gauge upstream of the housing and a gauge downstream of it at a known flow.
Two things make a cartridge different from every other device in a plumbing pressure budget.
The first is that the loss grows with time in service. A water meter loses pressure by a stable relationship with flow and gives the same number next year as today. A backflow assembly holds a fixed floor set by its check springs. A cartridge collects sediment, iron and scale continuously, which progressively closes off the open area available to flow, so its drop climbs from the day it is fitted until the day it is replaced. That is why one number cannot describe it.
The second is what happens at zero flow. A reduced pressure backflow assembly holds back several psi even when nothing is running, because its check springs exert force whether water is moving or not. A cartridge does the opposite: its loss is entirely frictional, so with no flow there is no drop at all. It costs you nothing when the house is asleep and its full price when every fixture is running.
Between those two facts sits the practical problem this page exists for. The cartridge is chosen against its clean drop, which is what the flow chart publishes, and it is replaced against a much larger drop, which is what the maintenance guidance specifies. The design has to survive the second number, and almost nobody budgets it.
Key Facts
- Good practice keeps the clean pressure drop below about 2 to 3 psi on a new cartridge, which is 13.8 to 20.7 kPa. This is the figure cartridges are selected against and what manufacturer flow charts publish.
- The common change-out trigger is a rise of 5 to 10 psi above the clean baseline, which is 34.5 to 68.9 kPa, measured with gauges either side of the housing.
- A cartridge selected at 2.5 psi clean can therefore be running at 7.5 to 12.5 psi by the time it is due for changing, up to five times the figure it was chosen on.
- Some cartridge instructions state the trigger as an absolute differential rather than a rise. For a 2.5 psi cartridge with a 10 psi figure, the rise form gives 12.5 psi and the absolute form gives 10.0 psi.
- A drop of 10 psi or more is commonly noticeable at fixtures, showing as slower faucets and weaker showers.
- One published three year field measurement of a whole-house system recorded 68 psi at the main before installation and 65 psi three years later, a 3 psi change on a properly sized system.
- A 20 inch cartridge passes roughly twice the flow of a 10 inch cartridge of the same filtration technology at the same pressure drop. The relationship is published as an approximation.
- The 4.5 inch diameter housing, sold as Big Blue, exists specifically to carry whole-house flow rates. The slim 2.5 inch housings are point of use devices.
- A finer micron rating restricts more: a 1 micron cartridge restricts considerably more than a 5 micron, which restricts more than a 20 micron.
- Pleated cartridges present more surface area than spun or melt blown cartridges of the same dimensions, so they offer less resistance at the same rating. Gradient density media holds more dirt before the drop climbs.
- Average household supply runs 40 to 60 psi. A 12.5 psi loaded drop is 15.6 percent of an 80 psi supply, 25 percent of 50 psi, and 31.3 percent of 40 psi.
- A two stage train at 2.5 and 3.0 psi clean totals 5.5 psi. Both stages loaded to their change-out point reach 25.5 psi, which is 175.8 kPa.
- NSF and ANSI standards for drinking water treatment units certify what a filter removes, the safety of its materials and its structural integrity. None of them publishes a pressure drop figure for a specific cartridge. Pressure drop comes from manufacturer flow curves.
- At zero flow a cartridge produces no pressure drop, because its loss is friction through media rather than spring force.
Applications
- A designer assembling a pressure budget needs a number for the filtration line and has to decide whether to use the clean figure or the loaded one. This page produces both and says which belongs in the budget.
- A homeowner whose pressure has fallen gradually over several months enters the clean baseline and the current gauge readings, and finds out whether the cartridge is due or whether something else is going on.
- A contractor sizing a whole-house system for a house on 45 psi checks whether a two stage train will still leave usable pressure at the fixtures when both cartridges are near the end of their interval.
- A service technician with gauges either side of the housing enters the measured drop and gets a change-out assessment against the clean baseline, rather than replacing cartridges on a calendar.
- A specifier compares a 10 inch slim housing against a 20 inch Big Blue housing before touching the micron rating, so the pressure is preserved without giving up filtration.
- A plans reviewer checks that the filtration allowance in a submitted pressure calculation was based on the loaded drop rather than the clean one.
Example Calculations
Example 1. The number that belongs in the budget
Given: a single sediment cartridge with a clean drop of 2.5 psi, which is 17.2 kPa, and the common 10 psi change-out allowance.
The clean total is 2.5 psi. The loaded total is 2.5 plus 10, which is 12.5 psi, or 86.2 kPa.
Result: the pressure budget needs 12.5 psi allocated to this filter, not 2.5. The difference is 10 psi, which on a 50 psi supply is a fifth of everything the house has. The clean figure describes one day in the cartridge's life and the loaded figure describes the day it matters.
Example 2. The budget that passes on paper and fails in service
Given: the same cartridge, with the pressure budget allowing 5 psi for filtration.
The clean total of 2.5 psi is comfortably inside the 5 psi allowance. The loaded total of 12.5 psi is two and a half times over it.
Result: over budget. A calculation that tested the clean figure against the allowance would have reported a pass, and the system would have worked perfectly for the first few weeks. This is the single most common way this page changes a decision.
Example 3. Two stages, three answers
Given: a sediment stage at 2.5 psi clean and a carbon stage at 3.0 psi clean, both on the 10 psi allowance. The sediment stage is due for change and the carbon stage was replaced recently.
Clean total: 5.5 psi, which is 37.9 kPa. This is what the train produced on the day both cartridges were new.
Current total: 12.5 for the loaded sediment stage plus 3.0 for the new carbon stage, which is 15.5 psi, or 106.9 kPa. This is what the house is feeling right now.
Fully loaded total: 12.5 plus 13.0, which is 25.5 psi, or 175.8 kPa. This is what the budget has to survive.
Result: three different numbers for the same installation, and each answers a different question. On a 50 psi flowing supply the loaded total is 51 percent of everything available, before a foot of pipe, the meter, elevation or any other device is counted.
Example 4. The change-out rule changes the answer
Given: the same 2.5 psi cartridge. Under the rise rule with a 10 psi allowance it is due for change at 12.5 psi. Under an absolute rule with a 10 psi figure it is due at 10.0 psi.
Result: 2.5 psi of difference on the same cartridge, purely from how the instruction is worded. Check which form your cartridge documentation uses rather than assuming, because applying the rise rule to a cartridge specified absolutely overstates the budget, and applying the absolute rule to one specified as a rise understates it.
Example 5. A measurement beats an assumption
Given: a sediment stage with a 2.5 psi clean baseline, marked part loaded, which the calculator would estimate at 7.5 psi. But a gauge either side of the housing reads 11.5 psi upstream and 2.5 psi downstream at the design flow.
The measured drop is 9.0 psi. That replaces the 7.5 psi estimate, and the rise above the clean baseline is 6.5 psi, roughly two thirds of the way through a 10 psi allowance.
Result: the cartridge is further through its interval than the estimate assumed, and the current total for the train is 1.5 psi higher than the estimate suggested. Where gauges exist, use them, and the result will say which stages were measured and which were assumed.
Example 6. Same filter, different verdict
Given: a loaded total of 12.5 psi on three different services.
On an 80 psi flowing supply that is 15.6 percent, a modest share.
On a 50 psi supply it is 25 percent, a significant share.
On a 40 psi supply it is 31.3 percent, a dominant share, and a low supply advisory as well.
Result: the filter has not changed. What has changed is how much pressure there was to spend. At or below about 40 psi there is little spare pressure to push through media, and a drop that would be unremarkable on a strong service becomes the deciding factor.
Example 7. The chart figure that does not match your flow
Given: a cartridge with a published clean drop of 2.5 psi, stated on the manufacturer chart at 10 GPM, which is 37.9 L/min. Your design flow is 20 GPM, which is 75.7 L/min.
The calculator does not scale the 2.5 psi figure. It reports a flow mismatch and marks the budget result preliminary.
Result: you have a number, and it belongs to a flow you are not designing for. There is no general multiplier that converts it, because cartridge curves differ by media type, micron rating, length and diameter. Read the drop off the manufacturer chart at 20 GPM before committing to a pressure budget. If the budget is comfortable the preliminary figure may be enough to proceed; if it is tight, it is not.
Example 8. Fixing a high drop without giving up filtration
Given: a 5 micron 10 inch cartridge whose loaded drop is more than the pressure budget can carry.
The first move is length: a 20 inch cartridge of the same 5 micron rating passes roughly twice the flow at the same drop. The second is diameter: a 4.5 inch Big Blue housing carries whole-house flow where a slim housing cannot. The third is construction: a pleated 5 micron cartridge offers more surface area than a spun one of the same size and rating.
Only after those does the micron rating come into it. Moving from 5 micron to 20 micron will certainly reduce the drop, and it will also stop catching everything between those two sizes.
Result: three levers preserve the filtration and one spends it. Work through them in that order, and if the rating does have to change, change it as a decision rather than as a fix.
Standards & References
- NSF Certified Drinking Water Treatment Units, the public searchable listing Confirms which standards a specific product is certified to and for which claims. Useful for checking what a cartridge is listed to remove; it carries no pressure drop figure, because certification does not cover pressure loss.
- NSF Certified Products and Systems, the full listing index by category The wider certification index. Certification to the drinking water treatment unit standards is issued by NSF, by the Water Quality Association through its Gold Seal programme and by IAPMO R and T, all testing to the same ANSI consensus standards and all publishing searchable databases.
- NSF Water Systems Programme Describes the scope of the standards for filtration and treatment products. NSF/ANSI 42 covers aesthetic effects such as chlorine taste, odour and particulate reduction; NSF/ANSI 53 covers health related contaminant reduction including lead, volatile organic compounds, cysts and PFAS; NSF/ANSI 58 covers reverse osmosis systems; NSF/ANSI 401 covers emerging contaminants; and NSF/ANSI 372 covers lead content in materials.
- Attribution note: pressure drop is manufacturer data, not certification data Those standards certify what a filter removes, that its materials are safe for drinking water, and that its housing will not fail structurally. None of them publishes a pressure drop figure for a specific cartridge, and no standards body does. Pressure drop is manufacturer data, published as a drop against flow curve for each cartridge, and the curve for the cartridge you are installing is the authority.
- The two criteria on this page are industry practice The clean drop guidance of 2 to 3 psi for a new cartridge comes from cartridge supplier sizing literature. The change-out guidance comes from manufacturer maintenance instructions, where a rise above a recorded clean baseline is the usual form: manufacturers commonly provide a place on the installation paperwork to write down the starting pressure and then the pressure at which the cartridge should be serviced, which is the same method this page uses. Neither figure is a code requirement, and where the cartridge you are installing states its own criterion, that criterion governs.
Units
Pressure is entered and reported in pounds per square inch and kilopascals, with the equivalent in feet of head where useful. Convert with 1 psi equal to 6.895 kPa, and 1 psi equal to 2.31 feet of head.
Useful reference points: a 2.5 psi clean drop is 17.2 kPa. A 10 psi allowance is 68.9 kPa. A 12.5 psi loaded drop is 86.2 kPa or 28.88 feet of head. A two stage loaded total of 25.5 psi is 175.8 kPa.
Flow is entered in gallons per minute or litres per minute. Convert with 1 GPM equal to 3.785411784 L/min, so 10 GPM is 37.9 L/min and 20 GPM is 75.7 L/min.
Cartridge dimensions stay in inches in both unit systems, because that is how housings and cartridges are sold and specified everywhere these products are used. A 10 inch cartridge is a 10 inch cartridge, and the 4.5 inch Big Blue diameter is a product designation rather than a measurement to convert.
The internal unit selector governs the fields, labels, math, on-screen result and any exported result, and it takes priority over any site-wide unit switch. Switching converts the values you entered rather than reinterpreting them, so 2.5 psi becomes 17.24 kPa and returns to exactly 2.5 psi when switched back.
Limitations
- This version covers cartridge filters in housings. Backwashing media tanks, iron and manganese filters, carbon tanks, softeners and ultraviolet systems are different device classes with different pressure behaviour and are not modelled here.
- The calculator does not scale pressure drop with flow. Manufacturers publish a drop against flow curve for every cartridge, and those curves differ by media type, micron rating, length and diameter, so no single formula describes them. Where your design flow differs from the flow the clean drop was stated at, the result says so and is marked preliminary rather than being scaled for you. Use the manufacturer curve at your design flow when the budget is tight.
- The 10 psi default allowance is the upper end of the published change-out range, chosen because budgeting the optimistic end of a range defeats the purpose of the page. It is adjustable per stage, and the result states when the default was used.
- The clean drop guidance of 2 to 3 psi and the change-out guidance of 5 to 10 psi are industry practice from cartridge suppliers and manufacturer maintenance literature rather than standards. No standards body publishes a pressure drop figure for a specific cartridge.
- The share of supply labels, and the thresholds at 40 psi for a low supply and 10 psi for a drop noticeable at fixtures, are screening values drawn from field practice. They give the result a shape and are not code limits.
- The change-out assessment bands, at a quarter and three quarters of the span between the clean and loaded figures, are a presentation choice to give a measured reading a shape. They are not published thresholds.
- The estimates from stage condition are approximations. Where gauges are available, enter the measured drop instead, and the result will distinguish measured stages from estimated ones.
- This version totals up to four cartridge stages in series. Where a train runs past four housings, total the extra stages separately and add the two figures: the arithmetic is a sum, so nothing is lost by splitting it.
- The page reports pressure at the filter train. It does not check pressure at the worst fixture, which needs elevation, downstream friction and the other device losses. Take the loss figure into the water pressure calculation for that.
- Cartridge life in months is out of scope, as are micron selection for a water quality problem, which contaminants need removing, pipe sizing and pump selection.
Common Mistakes to Avoid
- Budgeting the clean drop. The specification sheet figure is the smallest drop the filter will ever produce, and it describes one day in the cartridge's life. A cartridge chosen at 2.5 psi can be running at 12.5 psi by the day it is due for changing, and the budget has to survive that day.
- Testing the budget against the clean figure. A 5 psi allowance passes comfortably against a 2.5 psi clean drop and fails badly against a 12.5 psi loaded drop. The system works for a few weeks and then quietly stops working.
- Forgetting that stages accumulate. Two cartridges at 2.5 and 3.0 psi look like nothing at 5.5 psi combined. Both loaded reach 25.5 psi, which is half of a 50 psi supply before anything else in the system has been counted.
- Assuming both stages are in the same state. A sediment stage protecting a carbon stage loads faster than the stage behind it, so the realistic case is often one cartridge near the end of its interval and another partway through.
- Guessing the loading instead of measuring it. Two gauges either side of the housing turn an assumption into a reading, and the difference is often several psi.
- Applying the wrong change-out rule. A rise of 10 psi above a 2.5 psi baseline is 12.5 psi. An absolute figure of 10 psi is 10.0 psi. Check which form the cartridge instructions use rather than assuming.
- Using pressure drop data from a different cartridge. A 5 micron pleated cartridge, a 5 micron melt blown cartridge and a carbon block can have very different curves in the same housing size at the same rating. Match the data to the cartridge actually being installed.
- Scaling the published drop to a different flow. Cartridge curves are not a single shape, so doubling the flow does not double or quadruple the drop in any predictable way. Get the manufacturer curve at your flow instead of guessing at a multiplier.
- Going to a coarser micron as the first fix. It does reduce the drop, and it throws away part of the filtration the system was installed to provide. Try a longer cartridge, a larger diameter housing or a pleated construction first.
- Expecting a filter to cost pressure when nothing is running. A cartridge produces no drop at zero flow, because its loss is friction through media. If your static pressure has fallen, the filter is not the cause.
- Blaming the filter for a supply that was already marginal. On a 40 psi service a normal loaded drop consumes nearly a third of everything available. The filter is doing what filters do; the supply had no room for it.
Frequently Asked Questions
How much pressure does a whole-house filter take?
Should I use the clean pressure drop or the loaded one for sizing?
When should I change the cartridge?
Why did my water pressure drop after I installed a whole-house filter?
Does a bigger filter housing reduce the pressure drop?
Should I use a coarser micron rating to get my pressure back?
Does the calculator work out the drop from flow and micron rating?
Is the pressure drop covered by NSF certification?
What if my design flow is different from the flow on the chart?
How do I know if the cartridge is clogged?
Can a whole-house filter cause low water pressure?
Does a filter reduce static pressure when no water is running?
Frequently Used Together
Engineers often use these calculators in combination for complete project workflows:
Related Calculators
Explore similar calculators that might be useful for your project:
Plumbing Quick Reference — Keep It On Your Phone On Site
A 10-page field reference for catching pressure, velocity, slope, and pump-sizing mistakes before you order pipe, close a wall, or add a booster.
- Velocity limits, fixture pressure minimums, drain slope, and the 80 psi ceiling in one table
- Worked examples that show why a single pressure number gives four different answers
- Keep it on your phone, or print the two field-check pages
Free PDF. Calculators stay free. Unsubscribe anytime.
Calculate
This selector governs every field, label, result and export on this page, and it takes priority over the site header switch. Switching converts the values you entered rather than reinterpreting them, so 2.5 psi becomes 17.24 kPa and returns to exactly 2.5 psi when you switch back.
How many cartridge housings the water passes through in series. A typical whole-house train is a sediment stage followed by a carbon stage, so the sediment stage catches the particulate that would otherwise clog the more expensive carbon. Each stage carries its own clean drop, change-out rule, allowance and condition, and the drops add. Raising the count reveals the fields for the extra stages.
Stage 1
The drop across the first housing on a new cartridge, from the manufacturer flow chart or from your own gauge readings on the day it was fitted. This is the only required figure per stage and every other number on this page is built from it. Sizing practice keeps a new whole-house cartridge below about 2 to 3 psi, which is 13.8 to 20.7 kPa. A zero is rejected rather than accepted: a cartridge that costs no pressure is not filtering anything, and a blank field and a zero are different states here.
Cartridge instructions do not all state the trigger the same way, and the two forms give different answers on the same cartridge. The rise form replaces the cartridge when the drop has climbed by a stated amount above its clean baseline, which is the form most maintenance guidance uses. The absolute form replaces it when the total differential reaches a stated figure. On a 2.5 psi cartridge with a 10 psi figure the rise form gives 12.5 psi and the absolute form gives 10.0 psi, so the rule is an input rather than an assumption.
Under the rise rule this is the allowance added to the clean baseline; under the absolute rule it is the total differential at which the cartridge is replaced. Left blank, 10 psi is applied and the result says so. That is the upper end of the published 5 to 10 psi range, chosen because budgeting the optimistic end of a range is how a filtration allowance ends up short. It is taken per stage, because sediment and carbon cartridges carry different change-out guidance.
Used only for the current drop, which is what the train is producing today. New takes the clean drop, due for change takes the loaded figure, and part loaded takes the midpoint between them. It is ignored entirely when a measured drop is entered below, because a reading from the installation beats an assumption about it. Neither the clean total nor the loaded total depends on this field.
The difference between a gauge upstream of the housing and a gauge downstream of it, taken at a known flow with water running. It overrides the stage condition and unlocks the change-out assessment against the clean baseline. A reading below the clean drop is rejected: a cartridge collects sediment continuously and does not become less restrictive in service, so either the baseline or the reading is wrong, and the usual cause is two readings taken at different flows.
Where the clean figure came from. This changes confidence in the result rather than the result itself: it decides whether the calculator can tell you that your clean drop belongs to the flow you are designing for, and a figure with no confirmed basis marks the budget result preliminary.
The flow the chart figure was read at, or the flow your gauge reading was taken at. If it differs from the design flow the calculator says so and marks the budget preliminary. It never scales the drop, because cartridge curves differ by media type, micron rating, length and diameter and no multiplier converts a drop from one flow to another.
Supply and Budget (Optional)
The flow the filter train has to pass. A water supply fixture unit calculation is the usual source. It appears in no equation on this page and it changes no number: it exists only to establish whether the clean drop you entered has a matching flow basis, so it affects confidence in the result rather than the result itself.
The pressure still available upstream of the filter train while the system is passing its design flow, after the service line, the meter and any upstream device have taken their share. It unlocks the downstream figures and the share of supply. There is no static pressure field on this page: a cartridge produces no drop at zero flow, because its loss is friction through media rather than spring force.
The pressure the budget allows the filtration line, if one has been assigned. The test is run against the fully loaded total and never against the clean one, because the system has to work on the day before a cartridge change. Where the clean total is inside the allowance and the loaded total is not, the result says exactly that.