Why Dew Point Is a Vapor Pressure Wearing a Temperature
Dew point is the only psychrometric temperature that is not really a temperature at all: it is the air's water vapor partial pressure, restated as the temperature at which that pressure would be the saturation pressure, and every property it has follows from that disguise.
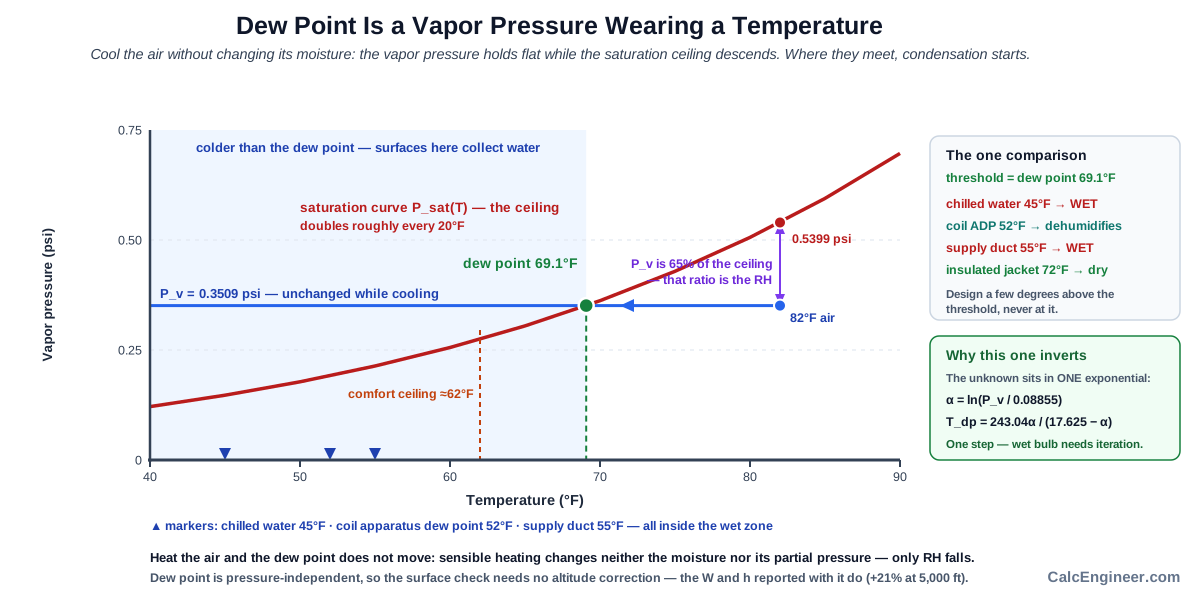
Air holds water vapor at some partial pressure, and the maximum that pressure can reach rises steeply with temperature along the saturation curve. Cool a parcel of air without adding or removing moisture and its vapor pressure stays fixed while the saturation ceiling descends toward it. Where the two meet, the air is saturated and condensation begins. That meeting temperature is the dew point. Because the vapor pressure did not change during the cooling, the dew point did not change either, which is why heating a room from 50 to 75°F (10 to 24°C) leaves the dew point exactly where it was while relative humidity falls from roughly 85% to 40%.
The calculator finds that temperature from any of four inputs, dry-bulb with relative humidity, dry-bulb with wet-bulb, dry-bulb with humidity ratio, or a vapor pressure entered directly, and returns the depression, relative humidity, humidity ratio, vapor pressure, saturation pressure, and enthalpy alongside it. The Wet Bulb article covered the evaporative limit and its implicit equation; this one covers the condensation threshold, whose equation inverts cleanly in closed form. The practical value is a single comparison: any surface colder than the dew point collects water. That comparison decides pipe insulation, duct insulation, glazing selection, and whether a cooling coil can dehumidify at all.
Calculator Inputs: Four Routes to the Same Threshold
Four input combinations reach the same threshold, and they differ only in what is known about the air before the calculation starts.
Unit System. Imperial (°F, gr/lb, psi, BTU/lb) or Metric (°C, g/kg, kPa, kJ/kg). Standard atmospheric pressure is assumed throughout: 14.696 psi (101.325 kPa).
Input Combination. Dry-Bulb with Relative Humidity, Dry-Bulb with Wet-Bulb, Dry-Bulb with Humidity Ratio, or Vapor Pressure Only.
Dry-Bulb Temperature [°F or °C]. The ordinary air temperature. Not required for the vapor-pressure route.
Relative Humidity [%]. 0 to 100, from a hygrometer or weather data.
Wet-Bulb Temperature [°F or °C]. From a psychrometer, at or below the dry-bulb.
Humidity Ratio [gr/lb or g/kg]. Used when the absolute moisture content is already known.
Vapor Pressure [psi or kPa]. Entered directly, typically from a moisture-transport analysis.
Outputs are Dew Point Temperature, Dew Point Depression ΔT, Relative Humidity, Humidity Ratio W, Vapor Pressure, Saturation Pressure at the dry-bulb, and Specific Enthalpy.
The common path:
whichever input → partial vapor pressure P_v → inverse Magnus → T_dp
Why the vapor-pressure route needs no temperature:
Dew point depends on vapor pressure alone.
Entering P_v directly returns the dew point without any dry-bulb at all.
Relative humidity, depression, and enthalpy are then unavailable,
because each of those requires knowing the air's actual temperature.
The four routes do not carry equal accuracy:
Vapor pressure entered directly: no approximation beyond the saturation relation
Dew point measured by chilled mirror: the same, when the instrument is calibrated
Humidity ratio: exact, when the value comes from a load calculation or design table
Relative humidity: inherits the hygrometer's accuracy, typically ±2 to 3%,
  which translates to roughly ±1°F (±0.5°C) of dew point
Wet-bulb: depends on the psychrometric relation used and on adequate aspiration
  over the wick, and carries the largest uncertainty of the four
For a dew point needed to commissioning accuracy, a measured dew point or a calibrated relative humidity reading is the sounder route.
Route selection in practice:
Relative humidity: the common instrument and weather-data route
Humidity ratio: when working from a load calculation or design table
Vapor pressure: when working from a moisture-transport or envelope analysis
Wet-bulb: the traditional psychrometer route
The calculator does not account for non-standard barometric pressure as an input, spatial variation of moisture within a stratified space, transient condensation behavior, surface temperature depression from impinging airflow, or the accuracy of the entering instrument readings. It performs single-state property derivation.
The Saturation Condition That Defines the Dew Point
The definition is a single equality: the dew point is the temperature at which the air's actual vapor pressure equals the saturation pressure.
P_v = P_sat(T_dp)
Saturation pressure by the Magnus approximation:
Metric:   P_sat = 0.61078 × exp(17.625 × T / (243.04 + T))   [kPa, T in °C]
Imperial: P_sat = 0.08855 × exp(17.625 × Tc / (243.04 + Tc)) [psi, Tc = (T_°F − 32)/1.8]

0.08855 = 0.61078 × 0.1450377, the base constant carried into psi
Getting P_v from each route:
From relative humidity: P_v = (RH/100) × P_sat(T_db)
From humidity ratio:    P_v = P_atm × W / (0.621945 + W), with W dimensionless
                        Field forms divide by pre-scaled constants: 621.945 for g/kg,
                        and 4,350 for gr/lb, rounded from 7,000 × 0.621945 = 4,353.6
Entered directly:       P_v as given
That rounding is worth naming, because the two field constants are not equally faithful. The metric 621.945 is exact against the dimensionless ratio, while the Imperial 4,350 is short of 4,353.6 by 0.08%. Carrying the dimensionless 0.621945 through the calculation and scaling by 7,000 at the end therefore returns a grains-per-pound figure a fraction of a grain above what the rounded constant gives: at the conditions worked below, 106.5 gr/lb against 106.4 gr/lb, a difference that does not survive to the displayed precision of any moisture calculation built on it. The worked example that follows carries the exact ratio.
Why the saturation curve is exponential:
Vapor pressure at saturation roughly doubles every 20°F (11°C) in the comfort range.
That steepness is why a modest cooling can push air from comfortable to saturated,
and why warm humid air carries so much more water than cool air.
The constant-moisture assumption:
The definition specifies cooling at constant pressure and constant moisture content.
Any process that adds or removes water moves the dew point;
any process that only changes temperature does not.
Worked from the Imperial example:
At 82°F (27.8°C): P_sat = 0.5399 psi (3.722 kPa)
At 65% relative humidity: P_v = 0.3509 psi (2.420 kPa)
The dew point is the temperature whose saturation pressure equals 0.3509 psi.
Per ASHRAE Handbook Fundamentals, Chapter 1: the dew point is defined by the equality of actual and saturation vapor pressure, with the saturation relation given by the Magnus approximation using constants 17.625 and 243.04 optimized for −40 to 60°C.
Closed-Form Inversion: Where Dew Point Solves and Wet Bulb Cannot
The saturation relation inverts algebraically, which is why the dew point drops out of a formula in one step while the wet bulb, whose equation contains the same exponential embedded in a larger balance, has to be iterated.
The inversion:
Starting from P_v = 0.61078 × exp(17.625 × T_dp / (243.04 + T_dp)):

α = ln(P_v / 0.61078)
T_dp = 243.04 × α / (17.625 − α)   [°C]
The base constant has to match the pressure unit. Working in psi, the same inversion runs against 0.08855 and returns °C directly, which is what the calculator does; converting P_v to kPa first (× 6.8948) and using 0.61078 gives the same answer to two decimal places. Either way the final step to Fahrenheit is T_dp(°F) = 32 + 1.8 × T_dp(°C).
Why it inverts:
The unknown appears in exactly one place, inside a single exponential.
Taking a logarithm exposes it as a ratio of linear terms, which rearranges directly.
The contrast with wet bulb:
The wet bulb equation contains the same exponential but also carries the unknown
in three other terms: in the leading coefficient, in a sensible-heat term, and in
the denominator. No logarithm untangles all four at once, so that equation is
transcendental and its solution is numerical. The dew point equation is not.
The practical consequence:
Dew point is computed once with no convergence criterion and no starting guess.
Two implementations of the inverse Magnus relation agree to the last digit,
whereas two wet-bulb solvers can differ in the third decimal depending on
tolerance and iteration scheme.
Accuracy of the inversion:
Better than 0.1°C (0.2°F) across the HVAC range of −40 to 93°C (−40 to 200°F),
limited by the Magnus fit rather than by the algebra.
Per Alduchov and Eskridge (1996) and Lawrence (2005): the Magnus saturation relation inverts in closed form because the unknown appears in a single exponential, giving the dew point directly. The wet-bulb balance carries the unknown in several terms at once and admits no such inversion.
Dew Point Depression and the Bands It Falls Into
The gap between dry bulb and dew point is the field-usable form of the same information, telling at a glance how close the air sits to condensing.
ΔT = T_db − T_dp [°F or °C]
Interpretation bands:
| Depression | Condition |
|---|---|
| Below 5°F (3°C) | Near saturation, condensation imminent |
| 5 to 15°F (3 to 8°C) | Low depression, high humidity |
| 15 to 35°F (8 to 19°C) | Typical comfort conditions |
| 35 to 55°F (19 to 31°C) | Dry |
| Above 55°F (31°C) | Very dry, cold outdoor air or overheated winter supply |
What the depression adds beyond the dew point itself:
The dew point alone answers where condensation occurs.
The depression answers how much margin the air currently has.
A dew point of 55°F (12.8°C) is unremarkable at 75°F (23.9°C) dry bulb
and alarming at 57°F (13.9°C).
Worked from the two examples:
82°F dry bulb, 69.1°F dew point: depression 12.9°F (7.2°C), low, high humidity
28°C dry bulb, 16.9°C dew point: depression 11.1°C (20.0°F), typical comfort
Relation to relative humidity:
Depression and relative humidity carry the same information at a given dry-bulb temperature,
but depression states it in degrees, which is the unit a surface temperature is measured in.
That makes the comparison against a pipe or duct direct.
Per ASHRAE practice: dew point depression bands run from below 5°F (3°C) at near-saturation to above 55°F (31°C) for very dry air, with 15 to 35°F (8 to 19°C) typical of comfort conditions. The depression expresses moisture margin in the same unit as a surface temperature.
The Surface Condensation Decision
The entire practical value of a dew point reduces to one comparison, and the comparison is a threshold rather than a gradient: a surface either sits above the dew point or it collects water.
The rule:
Surface temperature > dew point → dry
Surface temperature ≤ dew point → condensation
What this decides:
- Chilled water piping: insulation thickness chosen so the outer surface stays above the room dew point
- Supply air ductwork in unconditioned space: the same calculation against the ambient dew point of that space
- Glazing: interior surface temperature at design outdoor conditions against the interior dew point
- Basement walls and slabs: surface temperature against the summer interior dew point
- Cold equipment surfaces: refrigerant lines, chilled beams, radiant panels
Worked from the Imperial example:
A room at 82°F (27.8°C) and 65% relative humidity has a dew point of 69.1°F (20.6°C).
Chilled water at 45°F (7.2°C) runs 24.1°F (13.4°C) below that.
Bare pipe collects water continuously.
Insulation must be thick enough that its outer surface stays above 69.1°F (20.6°C).
Why relative humidity cannot make this decision:
A 65% reading says nothing about a surface until the dry-bulb temperature is also known.
The dew point folds both into one number in the same unit as the surface reading.
The radiant panel constraint:
Chilled radiant panels are limited by exactly this threshold: the panel surface
must stay above the space dew point, which caps the sensible capacity available
and is why radiant cooling is paired with dehumidified ventilation air.
The safety margin in practice:
Design surface temperatures a few degrees above the dew point rather than at it,
because local surface temperature varies, insulation is imperfectly installed,
and the space dew point drifts with occupancy and outdoor air.
Per ASHRAE Handbook Fundamentals: any surface at or below the local air dew point collects condensation, which makes the dew point the direct criterion for insulation thickness, glazing selection, and radiant panel surface limits.
Apparatus Dew Point: Whether a Coil Can Dehumidify at All
A cooling coil dehumidifies by being a cold surface in exactly the sense of the previous section, and whether it removes any moisture depends on how its effective surface temperature compares with the entering air's dew point.
The apparatus dew point:
ADP = the effective surface temperature the coil presents to the passing air
Typical chilled-water and direct-expansion coils: 45 to 55°F (7 to 13°C)
The condition for dehumidification:
ADP < entering air dew point → moisture condenses, latent capacity exists
ADP ≥ entering air dew point → sensible cooling only, no dehumidification
Worked against the Imperial example:
Entering air at 82°F (27.8°C) and 65% relative humidity, dew point 69.1°F (20.6°C).
A coil operating at an ADP of 52°F (11.1°C) sits well below that, so it condenses freely.
A coil operating at 70°F (21.1°C), as in a chilled beam or an elevated chilled water design,
sits above the dew point and removes no moisture whatever its airflow.
Why leaving air never reaches the ADP:
Part of the airstream passes between the fins without touching a wet surface.
That bypass air leaves at its entering condition and mixes with the treated air,
so the leaving state sits above saturation at the apparatus dew point.
Bypass fractions commonly run 0.05 to 0.20 depending on rows and fin spacing.
The connection to the latent load:
The moisture removed follows from the humidity ratio difference across the coil,
which the Latent Heat Load calculation converts into a cooling rate and a condensate flow.
The dew point decides whether that difference can be nonzero at all.
Elevated chilled water temperature:
Raising chilled water supply temperature improves chiller efficiency and
enables more economizer hours, but it raises the apparatus dew point toward
the entering dew point and erodes latent capacity. The trade is direct.
Per ASHRAE Handbook HVAC Systems and Equipment: a coil dehumidifies only when its apparatus dew point falls below the entering air dew point, and bypass air keeps the leaving state above saturation at that temperature.
Interstitial Condensation: Dew Point Plane by Plane
Inside a wall or roof assembly the same threshold test applies at every layer, and the assembly fails where the local temperature falls below the local dew point, often at a plane no one can see.
The method:
For each plane in the assembly, compute two things:
  the temperature at that plane, from the thermal resistances in series
  the dew point at that plane, from the vapor pressure profile
Condensation occurs wherever the temperature is at or below the dew point.
Why the two profiles differ in shape:
Temperature drops across the assembly in proportion to thermal resistance.
Vapor pressure drops in proportion to vapor permeance resistance.
The two resistances are distributed differently through the layers,
so the two profiles cross in some assemblies and not in others.
The classic failure:
Insulation placed inside a vapor-tight exterior sheathing puts a cold plane
behind a barrier the moisture cannot escape through.
Warm humid interior air reaching that plane condenses there.
Direction matters with climate:
In heating-dominated climates the vapor drive runs outward and the vapor retarder belongs
toward the interior. In cooling-dominated humid climates the drive reverses in summer,
and an interior vapor barrier can trap moisture migrating inward.
Assemblies designed for one direction can fail in the other.
Where a single-state dew point calculation fits:
It supplies the dew point of the air on each side of the assembly.
The plane-by-plane profile requires the assembly's thermal and vapor resistances,
which is a separate hygrothermal calculation, transient in the general case.
Per ASHRAE Handbook Fundamentals Chapter 27 and ASHRAE Standard 160-2021: interstitial condensation is evaluated by comparing the temperature and dew point profiles plane by plane through an assembly, with the vapor retarder position governed by the dominant seasonal vapor drive.
Frost Point Below Freezing
Below freezing, water vapor deposits as ice rather than condensing as liquid, and the temperature at which that happens sits above the dew point computed from the liquid-water saturation curve.
The distinction:
Dew point:   saturation with respect to liquid water, or supercooled liquid below 0°C
Frost point: saturation with respect to ice
At the same moisture content, the frost point is the higher of the two.
Why ice saturates at a lower pressure:
The saturation vapor pressure over ice is lower than over supercooled liquid water
at the same temperature, so the air reaches saturation with respect to ice
before it would reach saturation with respect to liquid.
The gap is not a fixed offset. It closes to zero at the freezing point and widens as the air gets colder:
Dew point −2°C (28°F):    frost point −1.8°C, gap 0.2°C (0.4°F)
Dew point −10°C (14°F):   frost point −8.9°C, gap 1.1°C (2.0°F)
Dew point −20°C (−4°F):   frost point −17.9°C, gap 2.1°C (3.8°F)
Where the difference matters:
Cold rooms and freezers: frost formation on coils and surfaces
Outdoor air intakes in winter: frost on preheat coils and energy recovery wheels
Cryogenic and low-temperature process work
Weather observation below freezing, where reported dew points may follow either convention
What the calculator returns below freezing:
It applies the liquid-water Magnus relation to the dew point itself,
so results below 32°F (0°C) are the supercooled-liquid dew point rather than the frost point.
Add the offset above to get the temperature at which ice actually begins to deposit,
or use an ice-saturation formulation where the distinction drives a decision.
Exhaust air passing through an energy recovery wheel in cold weather can reach its frost point on the wheel surface — frost control strategies exist precisely because of this threshold. Per ASHRAE Handbook Fundamentals: below freezing, vapor deposits as ice at the frost point, which sits above the liquid-water dew point at the same moisture content by an amount that grows with depth below freezing.
Below Freezing the Wet-Bulb Route Changes Equations
When the wet-bulb temperature itself falls below freezing, the relation linking it to moisture content changes, because the wetted surface sublimates ice rather than evaporating liquid water.
The two branches:
T_wb ≥ 0°C (32°F): the liquid-water balance, built on the latent heat of vaporization, 2,501 kJ/kg
T_wb < 0°C (32°F): the ice balance, built on the latent heat of sublimation, 2,830 kJ/kg
Why they differ:
Sublimation absorbs more energy per unit mass than evaporation, because the ice
must be melted as well as vaporized. The coefficients in the balance change accordingly,
and the saturation pressure at the wetted surface is taken over ice rather than water.
Phase selection is per temperature, not per state:
The branch of the moisture equation follows the wet-bulb temperature.
The saturation pressure at the dry-bulb, used for relative humidity, follows the
dry-bulb temperature independently.
Air at 5°C (41°F) with a wet-bulb of −2°C (28°F) uses the ice branch for the moisture
relation while its dry-bulb saturation pressure is still taken over liquid water.
Taking both over the same phase is the common implementation error, and it shifts
relative humidity by roughly 2% near freezing.
Continuity is not expected:
The two branches solve different energy balances, so results either side of freezing
do not join smoothly. Near 0°C (32°F) the moisture content inferred from a wet-bulb
reading carries elevated uncertainty, which ASHRAE notes explicitly.
Where it matters:
Winter outdoor air intakes, energy recovery wheels in cold climates, cold rooms
and freezers, and any commissioning measurement taken outdoors in winter.
Per ASHRAE Handbook Fundamentals, Chapter 1: the wet-bulb moisture relation has separate liquid-water and ice branches selected by the wet-bulb temperature, with saturation pressure taken over the corresponding phase. Results either side of freezing are not continuous, and moisture determination near 0°C is less certain.
Dew Point as the Climate Descriptor Design Data Uses
Weather data reports dew point rather than relative humidity for outdoor conditions because dew point does not swing with the daily temperature cycle, which makes it the stable descriptor of a climate's moisture.
Why relative humidity is unstable outdoors:
Overnight cooling raises relative humidity toward saturation and afternoon heating lowers it,
while the moisture content barely changes.
A single relative humidity figure for a location is therefore nearly meaningless.
Why dew point is stable:
It moves only when air masses change or moisture is added or removed.
A location's summer dew point characterizes its humidity in one number.
Typical design dew points:
Arid southwest: 50 to 60°F (10 to 16°C)
Temperate midwest summer: 65 to 72°F (18 to 22°C)
Gulf coast and humid subtropics: 75 to 80°F (24 to 27°C)
How design data presents it:
ASHRAE Climatic Design Conditions tabulate dew point at 0.4%, 1%, and 2% annual exceedance,
each with its mean coincident dry-bulb temperature.
Those pairs drive the outdoor-air latent load for any air handling unit.
The latent load link:
The ventilation moisture burden follows from the difference between the outdoor
humidity ratio and the indoor humidity ratio, and the outdoor value comes from
the design dew point rather than from a relative humidity figure.
Why dew point peaks separately:
The most humid hour is often not the hottest hour, which is why the dew point series
carries its own coincident dry-bulb rather than borrowing the dry-bulb design series.
Per ASHRAE Climatic Design Conditions: outdoor moisture is tabulated as dew point at annual exceedance levels with mean coincident dry-bulb, because dew point is stable through the daily temperature cycle while relative humidity is not.
The Comfort Ceiling Near 62 Degrees
Occupant perception of humidity tracks dew point more closely than relative humidity, which is why the comfort limit is expressed as a dew point ceiling.
The limit:
ASHRAE Standard 55 identifies roughly 62°F (17°C) as the upper dew point for comfort.
Above it, occupants perceive the air as humid regardless of the dry-bulb temperature.
Why perception follows dew point:
Skin cools by evaporating moisture, and the rate depends on the vapor pressure difference
between skin and air, which is what dew point measures.
Lowering the dry-bulb temperature without lowering the dew point does not restore
the evaporative gradient, which is why an over-cooled humid space still feels clammy.
Typical design targets:
Occupied office: 50 to 60°F (10 to 16°C) dew point
That corresponds to roughly 40 to 55% relative humidity at 75°F (24°C)
Supply air from a properly performing coil: 50 to 54°F (10 to 12°C) dew point
The lower bound:
Very low dew points bring their own complaints: dry eyes, static discharge,
and shrinkage in wood and paper. Winter indoor dew points below about 30°F (−1°C)
are commonly reported as uncomfortably dry.
The status of the limit:
Standard 55 is a thermal comfort standard rather than a code requirement,
so the dew point ceiling is a design recommendation, not a mandated threshold.
Sustained elevated humidity is separately treated by Standard 62.1 as an
indoor air quality concern, which is a different argument for the same control.
Per ASHRAE Standard 55-2023: an upper dew point near 62°F (17°C) marks the comfort limit, because humidity perception follows the vapor pressure gradient available for evaporative skin cooling rather than relative humidity.
Why Altitude Leaves Dew Point Alone but Moves Humidity Ratio
Of the psychrometric quantities affected by elevation, the dew point is the one that is not, because it depends only on vapor pressure while humidity ratio depends on the ratio of vapor pressure to the remaining air pressure.
The two dependencies:
T_dp: fixed by P_v alone. Total pressure does not enter.
W:    W = 0.621945 × P_v/(P_atm − P_v). Total pressure sits in the denominator.
The consequence:
At a given dew point, the vapor pressure is the same at sea level and at 5,000 ft (1,524 m).
The humidity ratio is not: the thinner air gives a smaller denominator and a larger W.
Worked illustration:
Dew point 55°F (12.8°C) corresponds to P_v = 0.2136 psi (1.473 kPa) at any elevation.
At sea level, P_atm = 14.696 psi:
  W = 7,000 × 0.621945 × 0.2136/(14.696 − 0.2136) = 64.2 gr/lb (9.18 g/kg)
At 5,000 ft (1,524 m), P_atm ≈ 12.23 psi:
  W = 7,000 × 0.621945 × 0.2136/(12.23 − 0.2136) = 77.4 gr/lb (11.06 g/kg)
Same dew point, about 21% more moisture per unit mass of dry air.
Which results need correcting:
The dew point itself is valid at any elevation with no correction.
The humidity ratio and enthalpy the calculator reports alongside it
assume standard pressure and need altitude-corrected values above roughly 1,000 ft (305 m).
The condensation decision is unaffected:
Because the surface comparison uses the dew point directly,
condensation assessment at elevation needs no pressure correction.
Load calculations built on the humidity ratio do.
Per ASHRAE Handbook Fundamentals: dew point depends only on vapor pressure and is independent of total pressure, while humidity ratio and enthalpy at the same dew point rise with elevation and require altitude-corrected atmospheric pressure above roughly 1,000 ft (305 m).
Worked Example: 82 Degrees at 65 Percent to a 69.1 Degree Dew Point
An occupied space in a humid climate at sea level: dry-bulb 82°F (27.8°C), relative humidity 65%, standard pressure 14.696 psi (101.325 kPa).
Step 1. Saturation pressure at the dry-bulb.
Tc = (82 − 32)/1.8 = 27.78°C
P_sat = 0.08855 × exp(17.625 × 27.78/(243.04 + 27.78))
      = 0.08855 × exp(1.8078) = 0.08855 × 6.0970 = 0.5399 psi (3.722 kPa)
Step 2. Actual vapor pressure.
P_v = 0.65 × 0.5399 = 0.3509 psi (2.420 kPa)
Step 3. Invert the saturation relation.
α = ln(0.3509/0.08855) = 1.3770
T_dp = 243.04 × 1.3770/(17.625 − 1.3770) = 334.67/16.2480 = 20.60°C
T_dp(°F) = 32 + 1.8 × 20.60 = 69.08°F
Step 4. Dew point depression.
ΔT = 82 − 69.08 = 12.9°F (7.2°C)
Low depression, high humidity band.
Step 5. Humidity ratio.
W = 0.621945 × 0.3509/(14.696 − 0.3509) = 0.218234/14.3451 = 0.0152148 lb/lb
W = 0.0152148 × 7,000 = 106.5 gr/lb (15.2 g/kg)
Step 6. Enthalpy.
h = 0.240 × 82 + 0.0152148 × (1,061 + 0.444 × 82)
  = 19.68 + 0.0152148 × 1,097.41 = 19.68 + 16.70 = 36.38 BTU/lb (84.6 kJ/kg)
Step 7. The condensation decision.
Any surface below 69.1°F (20.6°C) in this space collects water.
Chilled water at 45°F (7.2°C) sits 24.1°F (13.4°C) below the threshold.
Supply ductwork carrying 55°F (12.8°C) air sits 14.1°F (7.8°C) below it.
Both require insulation sized so the outer surface stays above 69.1°F (20.6°C).
Step 8. The comfort reading.
A dew point of 69.1°F (20.6°C) sits well above the ASHRAE 55 ceiling near 62°F (17°C).
The space would be perceived as humid regardless of its dry-bulb setpoint.
Step 9. The coil check.
A coil with an apparatus dew point of 52°F (11.1°C) sits far below 69.1°F (20.6°C),
so latent capacity is available and dehumidification will proceed.
Step 10. Result.
Dew point 69.1°F (20.6°C), depression 12.9°F (7.2°C), humidity ratio 106.5 gr/lb (15.2 g/kg),
enthalpy 36.38 BTU/lb (84.6 kJ/kg). Condensation threshold 69.1°F (20.6°C),
above the comfort ceiling, coil dehumidification available.
Ordering check: 69.1°F ≤ T_wb ≤ 82°F holds.
The Humidity Ratio Calculator produced the 106.5 gr/lb (15.2 g/kg) this state carries, the Latent Heat Load Calculator converts a humidity ratio difference across a coil into a moisture load, and the Wet Bulb Temperature Calculator supplies the third temperature in the ordering.
Metric Worked Example from a Known Humidity Ratio
A conditioned space where the moisture content is already known from a load calculation: dry-bulb 28°C (82.4°F), humidity ratio 12.0 g/kg (84.0 gr/lb), standard pressure 101.325 kPa (14.696 psi). This is the dry-bulb plus humidity ratio route, and no relative humidity reading is involved.
Step 1. Vapor pressure from the humidity ratio.
P_v = P_atm × W/(621.945 + W) = 101.325 × 12.0/(621.945 + 12.0)
    = 1,215.9/633.945 = 1.918 kPa (0.2782 psi)
Step 2. Saturation pressure at the dry-bulb.
P_sat_db = 0.61078 × exp(17.625 × 28/(243.04 + 28))
         = 0.61078 × exp(1.8208) = 0.61078 × 6.1766 = 3.7725 kPa (0.5472 psi)
Step 3. Relative humidity.
RH = (1.918/3.7725) × 100 = 50.8%
Step 4. Invert the saturation relation.
α = ln(1.918/0.61078) = ln(3.1403) = 1.1443
T_dp = 243.04 × 1.1443/(17.625 − 1.1443) = 278.11/16.4807 = 16.9°C (62.4°F)
Step 5. Dew point depression.
ΔT = 28 − 16.9 = 11.1°C (20.0°F)
Typical comfort band.
Step 6. Enthalpy.
h = 1.006 × 28 + (12.0/1,000) × (2,501 + 1.86 × 28)
  = 28.17 + 0.0120 × 2,553.08 = 28.17 + 30.64 = 58.81 kJ/kg (25.28 BTU/lb)
Step 7. The comfort reading.
16.9°C (62.4°F) sits essentially at the ASHRAE 55 ceiling near 17°C (62°F).
The space is at the edge of the humid perception threshold.
Step 8. The condensation decision.
Surfaces below 16.9°C (62.4°F) collect water.
Chilled water piping at 7°C (44.6°F) requires insulation.
A chilled radiant panel would have to hold its surface above 16.9°C (62.4°F),
which caps its sensible output and requires the ventilation air to carry the latent load.
Step 9. Contrast with the Imperial case.
The Imperial case had a dew point of 20.6°C (69.1°F) and a depression of 7.2°C (12.9°F).
This case has a lower dew point and a wider depression at a similar dry-bulb temperature,
which is the difference between a humid space and a properly dehumidified one.
Step 10. Result.
Dew point 16.9°C (62.4°F), depression 11.1°C (20.0°F), relative humidity 50.8%,
vapor pressure 1.918 kPa (0.2782 psi), enthalpy 58.81 kJ/kg (25.28 BTU/lb).
At the comfort ceiling, condensation threshold 16.9°C (62.4°F).
Per ASHRAE Handbook Fundamentals: entering a known humidity ratio gives the vapor pressure directly, and inverting the saturation relation returns the dew point without any iteration.
Application Boundaries: Pressure, Stratification, Frost, Surface Effects
The calculator covers the dew point and the associated moist-air state at a single point at standard atmospheric pressure, across four input routes, and screening against a condensation threshold. Several neighboring questions fall outside that scope.
Non-Standard Barometric Pressure. The dew point itself is pressure-independent and valid at any elevation, but the humidity ratio and enthalpy reported with it assume standard pressure and need correction above roughly 1,000 ft (305 m).
Spatial Variation and Stratification. A single state point does not describe a large or stratified space, where the dew point can vary substantially between floor and ceiling or between zones.
Frost Point. Results below 32°F (0°C) follow the liquid-water saturation curve and understate the frost formation threshold, by about 0.2°C (0.4°F) just below freezing and by 2.1°C (3.8°F) at a −20°C (−4°F) dew point.
Wet-Bulb Route Below Freezing. A wet-bulb temperature below 32°F (0°C) requires the ice branch of the moisture relation, with saturation taken over ice rather than water, and results near 0°C (32°F) carry elevated uncertainty.
Surface Temperature Depression from Airflow. Air impinging on a surface at velocity can drive the local surface temperature below the bulk value, producing condensation where a bulk-temperature comparison predicted none.
Interstitial Analysis. Plane-by-plane condensation within an assembly requires thermal and vapor permeance resistances for every layer, and in the general case a transient hygrothermal model.
Transient Behavior. The output is an equilibrium state. Condensation onset, drying rates, and moisture buffering by hygroscopic materials evolve over time.
Instrument Accuracy. The result inherits the accuracy of the entered readings. Capacitive relative humidity sensors carry ±2 to 3%, which translates to roughly ±1°F (±0.5°C) of dew point uncertainty.
Magnus Range. The saturation relation holds to better than 0.1°C (0.2°F) from −40 to 93°C (−40 to 200°F), and loses accuracy beyond it.
Per ASHRAE Handbook Fundamentals and Standard 160-2021: single-point dew point derivation at standard pressure is the calculator's scope. Altitude correction of the associated properties, stratification, frost point, sub-freezing wet-bulb branches, local surface effects, interstitial analysis, transient behavior, and instrument uncertainty require separate treatment. A qualified engineer completes the design.
Dew Point Temperature Calculator
Dew point temperature by inverting the saturation relation: converts the entered relative humidity, wet-bulb, humidity ratio, or vapor pressure into a partial vapor pressure, then solves the Magnus expression in closed form for the temperature at which that pressure would saturate the air. Depression, relative humidity, humidity ratio, saturation pressure, and enthalpy come with it. The result is the condensation threshold, so any surface at or below it collects water. Standard atmospheric pressure is assumed for the associated properties, though the dew point itself is pressure-independent.
Open Dew Point Temperature CalculatorStandards and References
- ASHRAE Handbook, Fundamentals (2021), Chapter 1, Psychrometrics. Dew point definition, saturation vapor pressure relations, the liquid-water and ice branches of the wet-bulb moisture relation, and the moist-air property formulations behind every route.
- ASHRAE Handbook, Fundamentals (2021), Chapter 27, Moisture in Building Construction. Interstitial condensation analysis using dew point as the threshold at each plane in an assembly.
- ASHRAE Standard 160-2021, Criteria for Moisture-Control Design Analysis in Buildings. Design criteria and analysis methods for envelope moisture performance.
- ASHRAE Standard 55-2023, Thermal Environmental Conditions for Human Occupancy. Upper dew point comfort limit near 62°F (17°C).
- ASHRAE Standard 62.1-2022, Ventilation and Acceptable Indoor Air Quality. Sustained elevated humidity as an indoor air quality concern.
- ASHRAE Climatic Design Conditions (published with the Fundamentals volume). Design dew point at 0.4%, 1%, and 2% annual exceedance with mean coincident dry-bulb.
- ASHRAE Handbook, HVAC Systems and Equipment (2020), Air-Cooling and Dehumidifying Coils. Apparatus dew point, bypass factor, and the condition for latent capacity.
- Alduchov and Eskridge (1996), Improved Magnus Form Approximation of Saturation Vapor Pressure, Journal of Applied Meteorology 35(4). Constants 17.625 and 243.04 optimized for −40 to 60°C.
- Lawrence (2005), The Relationship between Relative Humidity and the Dewpoint Temperature in Moist Air, Bulletin of the American Meteorological Society 86(2). Closed-form dew point inversion and its accuracy.
FAQ
What is dew point temperature?
Per ASHRAE Handbook Fundamentals: the temperature at which air becomes saturated when cooled at constant pressure and constant moisture content, so that its actual vapor pressure equals the saturation pressure. Below it, water condenses. At 82°F (27.8°C) and 65% relative humidity the dew point is 69.1°F (20.6°C).
Why does dew point stay the same when air is heated?
Per ASHRAE Fundamentals: because it depends only on the vapor pressure, and sensible heating changes neither the moisture present nor its partial pressure. Heating air from 50 to 75°F (10 to 24°C) leaves the dew point fixed while relative humidity falls from roughly 85% to 40%.
How do I use dew point to prevent condensation?
Per ASHRAE Fundamentals: compare it against the coldest surface temperature. Any surface at or below the dew point collects water, so insulation is sized until the outer surface stays above it, with a few degrees of margin for local variation and installation quality.
What is the difference between dew point and wet bulb?
Per ASHRAE Fundamentals: dew point depends only on vapor pressure and marks condensation, while wet bulb is the evaporative equilibrium temperature and depends on both moisture and dry-bulb. Dew point is always at or below wet bulb, and the two coincide only at saturation.
When can a cooling coil not dehumidify?
Per ASHRAE Systems and Equipment: when its apparatus dew point sits at or above the entering air dew point. The coil is then a warm surface in the sense that matters, and it performs sensible cooling only, no matter how much airflow passes over it.
Does dew point change with altitude?
Per ASHRAE Fundamentals: no. It depends on vapor pressure alone, so it is valid at any elevation without correction. The humidity ratio at that same dew point does change, rising about 21% at 5,000 ft (1,524 m) against sea level, so load calculations need altitude-corrected pressure.
Is the calculated value valid below freezing?
Per ASHRAE Fundamentals: it gives the liquid-water dew point. Below 32°F (0°C) vapor deposits as ice at the frost point, which sits higher at the same moisture content, by about 0.2°C (0.4°F) just below freezing and 2.1°C (3.8°F) at a −20°C (−4°F) dew point. A wet-bulb reading below freezing also requires the ice branch of the moisture relation.
Related Calculators
- Humidity Ratio Calculator: The absolute moisture content that fixes the vapor pressure behind this threshold (article).
- Wet Bulb Temperature Calculator: The evaporative limit, the middle of the three psychrometric temperatures (article).
- Psychrometric Calculator: Full air-state analysis across all moist-air properties at once.
- Enthalpy Calculator: Total heat content of the same air state.
- Latent Heat Load Calculator: The moisture load a coil removes once its surface sits below this threshold (article).
- Specific Volume Air Calculator: Volume per unit mass, needed to convert airflow into mass flow.
- Humidification Load Calculator: Winter moisture addition, the opposite direction of dew point control.
- Dehumidifier Sizing For Pools: Natatorium moisture control, where dew point governs both comfort and envelope protection.