Four Numbers the Calculator Does Not Supply
The calculation on the page is one addition and one subtraction. Everything that makes it worth doing happens before the arithmetic, because every quantity in it has to arrive from somewhere else.
A platform gains heat from the people standing on it, from the trains that stop at it, and from the equipment running on it, and it loses some through whatever air exchange the station has. Those are the four fields. None of them is a property of the station in the way that a wall U-value is a property of a building. A U-value can be read off a construction drawing and checked against the specification — none of these four can be read off anything.
The largest of them is not a building services quantity at all. A train arriving at a platform carries kinetic energy proportional to its mass and to the square of its speed, and stopping it converts that energy into heat somewhere. Where that somewhere is, and how much of the energy avoids becoming heat at all, depends on the braking system of the rolling stock rather than on anything the station designer controls. A 280 tonne (309 short ton) train entering at 60 km/h (37.3 mph) carries 38.9 MJ (36,900 BTU), and at 24 trains per hour that is 259 kW (883,700 BTU/h) of heat released underground before any allowance for what the traction equipment gives back.
The Subway Platform Heat Load Calculator is explicit about what it does. It sums the components entered into it, and its limitations section states that it does not model dynamic train movement through time, detailed tunnel airflow, passenger-flow transients, latent load, screen door performance or the emergency case. What follows works out where each of the four numbers comes from, derives the braking term from the mechanics, and shows how far a single feature of the trains moves the answer while every field on the page stays exactly as it was.
Calculator Inputs: Three Gains and a Subtraction
The field list is short, and its shape tells you what kind of model sits behind it.
Passenger Heat Gain            kW or BTU/h
Train-Related Heat Gain        kW or BTU/h
Lighting + Equipment Load      kW or BTU/h
Ventilation / Cooling Offset   kW or BTU/h, optional
Three of those are added and the fourth is taken away:
Total = Passenger + Train + Lighting − Offset
Equivalent Cooling [tons] = Total [BTU/h] / 12,000
The result lands in one of four bands:
LOW         below 100 kW      (below 341,214 BTU/h)
MODERATE    100 to 300 kW     (341,214 to 1,023,642 BTU/h)
HIGH        300 to 700 kW     (1,023,642 to 2,388,498 BTU/h)
VERY HIGH   700 kW and above  (2,388,498 BTU/h and above)
The page describes those bands as preliminary interpretation ranges. They are not transit code requirements, comfort guarantees or universal criteria, and no standard is cited behind them. The imperial edges are exact conversions of the metric cuts at 1 kW = 3,412.14 BTU/h, so a platform cannot read one category in one unit system and another category in the other.
What a field list of this shape means is worth stating plainly. The model adds quantities rather than deriving them, so an error in any one term passes into the result one for one, unscaled and unchecked. In the page example the largest term is the train contribution, and the section below shows what that number follows from.
What is absent from the field list is the more interesting half. There is no input for the service frequency or the train mass, which together set the braking heat. There is no input for whether the trains have regenerative braking, which changes that heat by a large fraction. There is no input for the number of people or how long they stay, which set the passenger term. And there is no input for platform screen doors, which change how the platform is connected to the tunnel at all.
Passengers: How Many and for How Long
The passenger term is the product of a number of people and a heat output per person. The second of those is tabulated. The first is set by the service pattern rather than by the size of the platform.
Total heat output from an adult is of the order of 100 W (341 BTU/h) at rest and appreciably higher when walking or climbing stairs, which is what people on a platform have just finished doing. ASHRAE Handbook, Fundamentals tabulates the figure by activity and divides it into sensible and latent parts, with the latent share growing as activity and air temperature rise. That split matters later, because the calculator works in total heat while equipment selection needs the two separated.
The number of people is not the capacity of the platform. It is an arrival rate multiplied by a dwell:
N = λ × t

N   people on the platform at once, persons
    typically hundreds at a busy station, thousands at a peak-hour interchange
λ   passenger arrival rate, persons/s
    from the ridership survey for the station, not assumed
t   mean waiting time, s
    about half the headway when arrivals are uniform, so 30 to 120 s
    at headways of 1 to 4 minutes
Run that backwards on the page example. A passenger term of 120 kW (409,500 BTU/h) at a total heat output of 120 W (409 BTU/h) per person is one thousand people standing on the platform at the same time. At a 2.5 minute headway the mean wait is 75 s, so one thousand people corresponds to an arrival rate near 13 persons per second, which is of the order of forty-eight thousand people per hour.
That is a major interchange in the peak hour, not an ordinary station. A station with a tenth of that arrival rate carries a tenth of the passenger term, and the field gives no hint of which of the two is meant. The steady-state form also hides the shape of the load, because a train arriving discharges several hundred people at once and the instantaneous density on the platform is well above the average the calculation uses.
Per ASHRAE Handbook, Fundamentals, on heat gain from occupants and Subway Environmental Design Handbook practice: the number of people on a platform follows from the arrival rate and the mean waiting time rather than from the platform area, and the heat output per person depends on the activity level.
Braking: The Kinetic Energy of the Train
The train term is the largest in the page example, and it follows from one line of mechanics. A moving train carries energy, stopping it removes that energy, and the energy has to go somewhere.
E = ½ × m × v²

E   kinetic energy of the train, J
m   train mass including passengers, kg
    150,000 to 400,000 kg (165 to 441 short tons) across systems and
    loadings; establish from the rolling stock data for the line
v   speed on entering the station, m/s
    11 to 25 m/s (36 to 82 ft/s), which is 40 to 90 km/h (25 to 56 mph)
Turn that into a rate using the service pattern:
P = E × n / 3600

P   heat released per unit time, W
n   trains per hour on the platform, 1/h
    6 to 40 depending on the line and the time of day
Take a six-car train of 280 t (309 short tons) with passengers, entering the station at 60 km/h (16.67 m/s, 54.7 ft/s), at 24 trains per hour. Those are assumptions, chosen and named, not typical values:
E = 0.5 × 280,000 × 16.67² = 38.9 MJ (36,900 BTU) per stop
P = 38.9 × 10⁶ × 24 / 3600 = 259 kW (883,700 BTU/h)
That figure is more than twice the passenger term of the page example, and it came out of a mass and a speed. Neither is a property of the station. The dependence on speed is quadratic, so a train entering at 80 km/h (49.7 mph) instead of 60 carries 69.1 MJ (65,500 BTU) rather than 38.9, a factor of 1.78 on the same rolling stock.
Where the energy ends up depends on the brakes. Friction braking turns all of it into heat in the brake gear, which is dissipated into the tunnel and the station. Regenerative braking returns part of it to the supply and leaves only the remainder as heat, which is the subject of the next section.
The train term covers more than braking. Traction losses as the train accelerates away, rolling and aerodynamic resistance on the approach, and the heat the train rejects from its own air conditioning all belong in the same field, and whether the number entered includes them is not recoverable from the result.
Per Subway Environmental Design Handbook and transit environmental practice: the braking contribution follows from the kinetic energy of the arriving train and the service frequency, so it is set by the mass, the approach speed and the headway rather than by any property of the station.
Regeneration Changes the Largest Term
Whether the trains give braking energy back to the supply moves the largest component of the platform load by roughly a third, and nothing on the calculator asks about it.
Under regenerative braking the traction motors work as generators. The energy they produce is returned to the third rail or the overhead, where another train drawing power at that moment consumes it, or where a wayside storage unit accepts it. The fraction actually recovered depends on the supply arrangement and on whether there is anything to receive it.
What happens to the rest is the part that concerns the station. If nothing on the section can take the energy, the converter dumps it into braking resistors carried on the train, and it becomes heat there. From the platform's point of view the difference between that and friction braking is small, because the heat is released into the underground space either way.
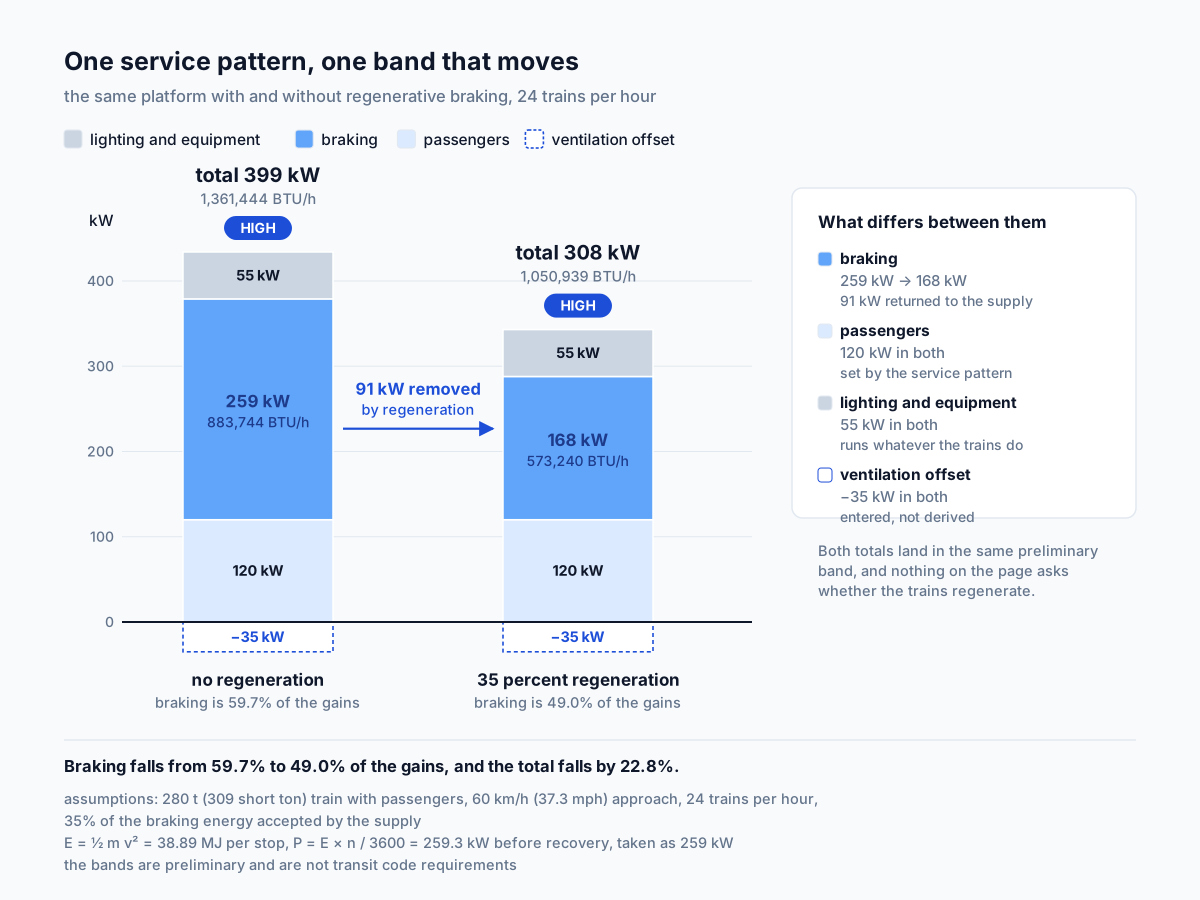
Under the same assumptions as the section above:
No regeneration:                       259 kW (883,700 BTU/h)
With 35 percent of the energy returned: 168 kW (573,200 BTU/h)
Difference:                             91 kW (310,500 BTU/h)
Put those into the sum with a passenger term of 120 kW (409,500 BTU/h), lighting and equipment of 55 kW (187,700 BTU/h) and a ventilation offset of 35 kW (119,400 BTU/h):
No regeneration: 120 + 259 + 55 − 35 = 399 kW (1,361,400 BTU/h)
With regeneration: 120 + 168 + 55 − 35 = 308 kW (1,050,900 BTU/h)
Both land in the HIGH band — the same preliminary category, a different plant. They differ by 22.8 percent of the larger, and braking falls from 59.7 percent of the gains to 49.0 percent.
The recovered fraction is not a constant of the rolling stock. It depends on whether another train is accelerating on the same supply section at the moment of braking, so it falls when the service is sparse. Recovery is worst precisely when headways are long, which is also when the total load is lowest, so the peak-hour design case suffers less from it than the off-peak one.
The consequence for anyone filling in the field is that the train term needs the rolling stock and the traction supply as well as a timetable.
Per transit traction practice and Subway Environmental Design Handbook: regenerative braking returns part of the kinetic energy to the supply, and the fraction accepted depends on whether another train is drawing power at the same moment, so the heat released underground varies with the service pattern as well as with the equipment.
The Train Brings Its Own Cooling Load
An air-conditioned train rejects the heat it removes from its interior into the space around it. While it stands at a platform, that space is the platform.
The on-board plant takes heat out of the saloon and pushes it through condensers into the outside air. In the tunnel, the outside air is the tunnel. At a station, it is the station. The train is a cooling load that arrives, unloads and leaves, and it is not a small one.
Installed cooling capacity per car runs to tens of kilowatts, and the heat rejected exceeds it by the power the plant draws. A six-car train therefore rejects a figure measured in hundreds of kilowatts while its air conditioning runs at full output, which is comparable with everything else on this page put together.
Only part of that lands on the platform, and the share follows from the dwell time relative to the headway. With a 30 s dwell and a 150 s headway, a fifth of the train's operating time is spent at the platform, so about a fifth of its rejected heat goes there directly. The rest goes into the tunnel, and some of that returns later with the air.
Two things push the figure up. Open doors during the dwell admit warm platform air into the saloon, which raises the load the on-board plant has to remove and therefore the heat it rejects. And a hot tunnel reduces the efficiency of the on-board plant, which raises its power draw and again the heat rejected.
That second effect closes a loop. The warmer the underground space, the more heat the trains reject into it, and the warmer it becomes. This feedback is among the reasons temperatures in deep systems have climbed over decades of operation.
For the field on the page it means the train term is not the braking term. Where the fleet is largely air conditioned, the on-board contribution is of the same order as braking, and both belong in the same box.
Per ASHRAE Handbook, HVAC Applications, on mass transit and Subway Environmental Design Handbook: on-board air conditioning rejects heat into the surrounding space, and the share attributable to the platform follows from the dwell time relative to the headway.
Lighting Is the Small Part of the Equipment Term
The third field is named for lighting, and on a modern station lighting is the smallest thing in it.
What the term actually covers is the whole permanent electrical installation inside the station volume: platform, trackway and back-of-house lighting, escalators and lifts, communications, signalling and train control equipment, passenger information displays, fare collection, and any ventilation plant whose motors sit inside the station rather than in a separate shaft.
The proportions come out of a division. Platform lighting at modern luminaire efficacies and normal maintained illuminance is a few watts per square metre. The 55 kW (187,700 BTU/h) of the page example, spread over a platform of the order of 1,500 m² (16,100 ft²), is about 37 W/m² (11.7 BTU/(hr·ft²)). Lighting is a minority share of that by a wide margin.
The bulk of it is escalators running whether or not anyone is on them, and equipment that is never switched off. Fans add to it wherever their motors sit inside the station volume rather than at the head of a shaft.
The useful property of this term is that it is stable. Unlike the passenger and train terms, it barely moves across the day, and it continues at full value through the small hours when service is thin and the platform is empty. A station that is comfortable at 03:00 with only this term running is a different design problem from one that is comfortable at 08:30.
The composition has also shifted over time. Conversion to LED cut the lighting part substantially, while communications, video surveillance and passenger information systems grew over the same period, so the total has moved much less than the lighting figure alone would suggest.
Per Subway Environmental Design Handbook and station design practice: the internal electrical load of an underground station is dominated by continuously operating equipment rather than by lighting, and it persists through periods of low service.
What the Offset Actually Represents
The fourth field subtracts rather than adds, and what it stands for decides whether subtracting it is appropriate at all.
It can mean at least three different things. It can be natural air exchange through entrances, concourses and ventilation shafts, carrying heat out of the station without any plant involved. It can be mechanical ventilation moving outside air through the station without cooling it. Or it can be installed refrigeration capacity, where the project provides one.
The distinction matters because the first two remove heat with air whose temperature cannot fall below that of the outside or tunnel air supplying it, while the third can hold the station below that temperature. The 35 kW (119,400 BTU/h) in the page example could be any of the three — nothing in the result says which.
The order of magnitude is easy to check for the natural case:
Q = P / (ρ × c × ΔT)

Q   volume flow, m³/s
P   heat removed, W
ρ   air density, 1.2 kg/m³ at ordinary station conditions
c   specific heat capacity of air, 1,005 J/(kg·K)
ΔT  temperature rise of the air removing the heat, K
    5 to 15 K (9 to 27 °F) for a station in normal operation
At ΔT = 10 K (18 °F), removing 35 kW needs 35,000 / (1.2 × 1,005 × 10) = 2.9 m³/s, which is about 6,150 CFM. That is a modest flow for a station and is reachable by natural exchange through the entrances alone.
The weakness in the field is structural. If the offset represents ventilation, its magnitude depends on the temperature difference, and the temperature difference depends on the answer the calculation is producing. Entering it as a fixed number asserts a final temperature that the calculation never checks.
The safe way to use it is to leave it empty when the question is how much heat has to be removed, and to fill it only when the removal has been established independently.
Per the calculator's stated basis: the offset is an optional relief term subtracted from the sum, and whether it represents natural exchange, mechanical ventilation or installed cooling determines both its magnitude and whether it depends on the result it is being subtracted from.
The Piston Effect Works Both Ways
The air a train pushes ahead of itself ventilates the station for nothing, and the same motion removes air the station may have spent energy conditioning.
A train filling much of a tunnel bore displaces the air in front of it and drags air along behind it, which sets up a longitudinal flow through the whole system. At the platform this appears as a gust as the train approaches and a reverse flow as it leaves.
The favourable side is substantial. Air is exchanged between the station and the surface with no energy input and no plant, and in systems without mechanical ventilation this is the principal mechanism for removing heat and contaminants from the underground volume.
The unfavourable side is equally real. Gusts at the platform edge appear in design work as a limit on air velocity in the occupied zone, and where a station is mechanically cooled the same motion drags conditioned air into the tunnel, a direct loss against the plant that produced it.
What sets the magnitude is the blockage ratio, the cross-sectional area of the train against that of the tunnel, together with the train speed and the presence of relief paths. Ventilation adits and shafts near stations exist partly so that displaced air has somewhere to go other than across the platform.
For the calculation, the piston effect is present in several terms at once. It carries heat away, it brings tunnel heat in, and it changes the size of any offset representing air exchange. It has no field, and it is inside the four numbers whether or not whoever entered them intended it.
The road tunnel case treats the same mechanism differently. There it is a source of ventilation that reduces fan duty, because nobody is standing in a road tunnel by design. A station is an occupied space, which is why the same air movement is read as a benefit and a constraint at the same time.
Per Subway Environmental Design Handbook and station ventilation practice: train motion drives air exchange between the station and the outside without energy input, while the same motion carries conditioned air into the tunnel and produces air velocity at the platform edge that is itself a design limit.
Platform Screen Doors Change the Problem
A wall of doors between the platform and the track separates two environments that are otherwise one, and that changes which of the four terms matter.
Platform screen doors close off the platform volume from the trackway and the tunnel, opening only during the dwell and aligning with the train doors. Implementations run from full height to half height, and the thermal consequence follows the degree of separation.
Three things change in the load. Heat released in the tunnel, including the braking heat dissipated on the approach and the on-board rejection during running, stops reaching the platform directly. The piston effect stops acting on the platform, and the longitudinal air movement stays in the trackway. The passenger term and the station equipment term do not change at all.
Two things appear in their place. The trackway and tunnel volume now needs ventilation of its own, because the heat in it is no longer being carried away through the station. And the exchange through the open doors during each dwell becomes a term in its own right, driven by the temperature difference across the doorway and by the dwell time.
Doors are usually installed for safety and for the ability to condition the platform as a defined volume. The reduction in heat reaching it follows from that decision rather than motivating it.
For the calculation the consequence is direct. A station with screen doors and a station without them are two different problems with two different sets of terms, the page has no field for which one is being modelled, and the train term has to be established differently in each case.
Per NFPA 130 and station design practice: platform screen doors separate the platform environment from the trackway, which removes tunnel heat and piston effect from the platform while transferring the ventilation duty for the trackway to a separate system.
The Fire Case Is a Different Calculation
The station has a second design condition. It shares its ventilation equipment with the first and has nothing to do with cooling.
A fire on the platform or in a train at the platform requires that smoke be moved so that the means of egress stay usable for as long as evacuation takes. The quantity being designed is an air flow rate and a direction, not a heat load, and the acceptance criteria are tenability along the escape route rather than a temperature in the occupied zone.
Three things separate it from the normal case. The heat release rate of a fire is orders of magnitude above the steady-state load of the station. The requirement is control of the direction of smoke movement rather than of a temperature. And the escape routes lead upward, which is where smoke goes unaided, a geometry that distinguishes a station from a horizontal road tunnel.
The equipment follows from this case rather than from the cooling one. Emergency ventilation fans are selected on the fire case and have to keep running at elevated temperature for a specified period, while the installed capacity needed in normal operation is usually lower.
The two cases are linked through hardware. The same shafts and often the same fans serve both, so the arrangement of the ventilation system is set by the emergency case and normal operation works within it.
None of this is in the model. The page lists emergency smoke control among the things it does not address, and it is right to do so, because the two calculations share almost nothing but the equipment they end up specifying.
Per NFPA 130: emergency ventilation for stations and trainways is a separate design case governing fan selection and system arrangement, and it is not addressed by a steady-state heat load calculation.
Worked Example: 320 Kilowatts Across Four Terms
The metric example on the page, worked through and then interrogated.
Passengers                  120 kW (409,500 BTU/h)
Trains                      180 kW (614,200 BTU/h)
Lighting and equipment       55 kW (187,700 BTU/h)
Ventilation offset           35 kW (119,400 BTU/h)
Step 1. Sum the terms. Three gains added, one relief subtracted:
120 + 180 + 55 − 35 = 320 kW (1,092,000 BTU/h)
Step 2. Convert to cooling tons. One ton of refrigeration is 12,000 BTU/h (3.517 kW):
1,092,000 / 12,000 = 91.0 tons
Step 3. Read the band. 320 kW falls between the 300 and 700 kW cuts, so the result is HIGH. The band is preliminary and carries no transit code requirement behind it.
Step 4. Look at the composition. The gains sum to 355 kW (1,211,300 BTU/h) before the subtraction:
Trains                 180 of 355 kW, 50.7 percent
Passengers             120 of 355 kW, 33.8 percent
Lighting and equipment  55 of 355 kW, 15.5 percent
Offset                  35 of 355 kW, 9.9 percent of the gains
Step 5. Test the passenger term. At 120 W (409 BTU/h) per person, 120 kW is one thousand people on the platform at once. At a 2.5 minute headway with a 75 s mean wait, that is an arrival rate of the order of forty-eight thousand per hour. This is a major interchange in the peak, and a suburban station would not produce it.
Step 6. Test the train term. The kinetic energy calculation for a 280 t (309 short ton) train at 60 km/h (37.3 mph) and 24 trains per hour gives 259 kW (883,700 BTU/h) with friction braking and 168 kW (573,200 BTU/h) with 35 percent recovery. The 180 kW entered on the page sits close to the second, so the example implicitly describes a fleet with regenerative braking and little else in the train term.
Step 7. Substitute the friction case. Putting 259 kW in place of 180 gives 399 kW (1,361,400 BTU/h), still HIGH, but 24.7 percent above the figure the page returns. The band does not move; the plant does.
Step 8. Raise the approach speed. Kinetic energy goes with the square of speed, so entering at 80 km/h (49.7 mph) rather than 60 multiplies the braking term by 1.78, taking it from 168 to 299 kW (573,200 to 1,020,200 BTU/h) at the same recovery fraction. The total becomes 439 kW (1,498,000 BTU/h).
Step 9. Ask what is not in the four numbers. Heat arriving from the tunnel with the air, on-board air conditioning rejected during the dwell, and the surge as a train discharges its passengers. Any of these can be inside the train term if whoever filled it in put them there, and the result gives no way to tell.
Step 10. Decide what the answer is for. It is a screening figure for the scale of the problem and for early plant space planning. Beyond that the work needs a dynamic station environment simulation, one that follows train movements through time and couples the platform to the tunnel.
Imperial Example and the Sensitivity to Service Frequency
The same platform in imperial units, entered directly rather than converted after the fact:
Passengers                  409,500 BTU/h (120 kW)
Trains                      614,200 BTU/h (180 kW)
Lighting and equipment      187,700 BTU/h ( 55 kW)
Offset                      119,400 BTU/h ( 35 kW)

Total                     1,092,000 BTU/h (320 kW)
Equivalent cooling        1,092,000 / 12,000 = 91.0 tons
Band                      1,023,642 to 2,388,498 BTU/h, HIGH
The two systems agree to within the rounding of the inputs. Converting the metric total directly gives 320 × 3,412.14 = 1,091,885 BTU/h, so the 1,092,000 figure is high by 0.01 percent. The band is the same in both, because the classification runs on one quantity and the cuts are exact conversions of each other.
Now vary the thing the page has no field for. The braking term is proportional to the number of trains per hour, so at the same mass, approach speed and 35 percent recovery:
12 trains/h:   84 kW (286,600 BTU/h), total 224 kW (764,300 BTU/h)  MODERATE
18 trains/h:  126 kW (429,900 BTU/h), total 266 kW (907,600 BTU/h)  MODERATE
24 trains/h:  168 kW (573,200 BTU/h), total 308 kW (1,050,900 BTU/h) HIGH
30 trains/h:  210 kW (716,500 BTU/h), total 350 kW (1,194,200 BTU/h) HIGH
36 trains/h:  252 kW (859,900 BTU/h), total 392 kW (1,337,600 BTU/h) HIGH
Tripling the service raises the total by 75 percent rather than tripling it, because two of the three gains do not depend on frequency directly. The band edge is crossed between eighteen and twenty-four trains per hour: a 300 kW total needs a braking term of 160 kW, which at 7.0 kW per train per hour is about 22.9 trains per hour.
One caution about reading that table as a sensitivity. More frequent service shortens the wait and therefore reduces the number of people standing on the platform for the same arrival rate, so the passenger term moves the other way. Holding it at 120 kW across the whole range, as the table does, overstates the total at the high-frequency end and understates it at the low end.
Per Subway Environmental Design Handbook practice: the braking contribution scales directly with service frequency while the passenger contribution scales inversely with it through the waiting time, so the two respond to a change in headway in opposite directions.
Application Boundaries: Transients, Coupling, Simulation
The model sums entered components of a platform heat load with an optional subtraction. Everything below needs separate treatment.
Where the components come from. All four arrive from outside, and the calculation offers no route to any of them.
Braking heat. Follows from train mass, approach speed, service frequency and the presence of regeneration, none of which is a field.
On-board air conditioning. Heat rejected during the dwell may or may not be inside the train term, and the result cannot be inspected to find out.
Coupling with the tunnel. Heat arriving with tunnel air and conditioned air carried out by the piston effect are not represented.
Platform screen doors. They change which terms apply, and there is no field for whether they are fitted.
Transients. A train arrival produces a short-lived peak in both occupancy and heat release that a steady-state sum does not describe.
Latent load. The calculation works in total heat, while equipment selection needs the sensible and latent parts separated, and the latent share rises with occupant activity and air temperature.
The emergency case. Handled separately, and it governs fan selection and the arrangement of the ventilation system.
The interpretation bands. Preliminary, with no transit code requirement or comfort guarantee behind them.
Per the calculator's stated scope and Subway Environmental Design Handbook: summing entered components is the scope of this model, while deriving those components, coupling with the tunnel, transient behaviour, latent load and the emergency case each require separate treatment.
Subway Platform Heat Load Calculator
Subway platform heat load by summation: it adds the passenger, train and equipment gains, subtracts an optional ventilation offset, and places the total in a preliminary band. All four figures arrive from outside the calculation, and the largest of them in most stations follows from the kinetic energy of arriving trains and from whether their braking returns energy to the supply. The arithmetic is one line; establishing the four numbers is the work. A screening estimate, not a station environment simulation.
Open Subway Platform Heat Load CalculatorStandards and References
- Subway Environmental Design Handbook, Volume I, Principles and Applications (current edition). The reference work on environmental control in underground transit, running from design criteria through heat load derivation to the selection of systems and equipment.
- ASHRAE Handbook, HVAC Applications, chapter on mass transit facilities (American Society of Heating, Refrigerating and Air-Conditioning Engineers, current edition). Underground station environments, including coupling with the tunnel, the effect of train movement and the treatment of on-board heat rejection.
- ASHRAE Handbook, Fundamentals, chapters on heat gain from occupants and on psychrometrics (American Society of Heating, Refrigerating and Air-Conditioning Engineers, current edition). Total heat output per person by activity level, its division into sensible and latent parts, and the moist air properties behind the airflow check on the offset.
- NFPA 130, Standard for Fixed Guideway Transit and Passenger Rail Systems (National Fire Protection Association, current edition). Requirements for stations, trainways and emergency ventilation, and the basis for treating the fire case as a separate design condition.
- Transportation Research Board, Test Simulations of a Single-Track Subway Environment (current edition). Simulation of the subway environment covering heat release, air movement, temperature and humidity, and the behaviour that a steady-state sum leaves out.
- ASHRAE, Sustainable Design in Metro Stations (conference paper, current edition). Station air conditioning concepts, including platform screen doors and the cooling strategies that follow from separating the platform from the trackway.
- Rolling stock manufacturer data (current published editions). Train mass in tare and loaded condition, braking system type and the presence of regeneration, and installed capacity and power draw of on-board air conditioning.
- Literature on regenerative braking in rail transit (current editions of the traction and rail engineering literature). Recoverable fractions of braking energy, the conditions under which the supply can accept them, and the use of wayside storage where it cannot.
- Design practice for stations with platform screen doors (current published editions of transit station design guidance). The effect of separating the platform and trackway volumes on heat load and on the ventilation duty that then falls to the trackway.
FAQ
Where does the train heat gain figure come from?
Per Subway Environmental Design Handbook practice: from the kinetic energy of arriving trains and the service frequency. A 280 t (309 short ton) train entering at 60 km/h (37.3 mph) carries about 38.9 MJ (36,900 BTU), and at 24 trains per hour that is 259 kW (883,700 BTU/h) before any allowance for regeneration. The calculator does not derive it, and the mass, speed and headway are not among its fields.
How much does regenerative braking change the answer?
Per traction practice: by roughly a third of the largest term. At 35 percent recovery the braking contribution in the case above falls from 259 to 168 kW (883,700 to 573,200 BTU/h), taking a 399 kW (1,361,400 BTU/h) platform total down to 308 kW (1,050,900 BTU/h). The fraction actually recovered depends on whether another train is drawing power at that moment.
How many people does the passenger term represent?
Per ASHRAE Handbook guidance on occupant heat gain: at around 120 W (409 BTU/h) per person, a 120 kW (409,500 BTU/h) passenger term is about one thousand people on the platform at once. With a 2.5 minute headway and a mean wait of half of that, this corresponds to an arrival rate of the order of forty-eight thousand people per hour.
Is lighting really the main part of the equipment term?
Per station design practice: no. Platform lighting at modern efficacies is a few watts per square metre, while the term also covers escalators, lifts, communications, signalling, information displays and fare collection, all running continuously. The equipment share persists through periods of low service when the train and passenger terms fall away.
What should the ventilation offset be?
Per the calculator's stated basis: whatever heat removal has been established independently. It may represent natural exchange through entrances, mechanical ventilation without cooling, or installed cooling capacity, and the three differ in magnitude and in whether they depend on the resulting temperature. Leaving the field empty gives the full load to be removed.
Do platform screen doors reduce the load?
Per NFPA 130 and station design practice: they change which terms apply rather than simply reducing the total. Tunnel heat and piston effect stop reaching the platform, while the trackway acquires a ventilation duty of its own. The station with doors and the station without them are different calculations.
Can this size the station cooling plant?
Per the calculator's stated scope: no. It sums components entered by the user and does not model train movement through time, tunnel airflow, passenger transients or latent load. Equipment selection follows from dynamic station environment simulation, and the emergency ventilation case governs fan selection separately.
Related Calculators
- Tunnel Ventilation Rate: longitudinal ventilation of the tunnel the platform exchanges air with wherever screen doors are absent, and the place most of the braking heat is actually released (article).
- Cooling Load Calculator: the load of an ordinary room, where the heat sources stay still and there is no long underground volume next door to trade air with.
- HVAC Heat Load Calculator: envelope conduction gains, which dominate a building above ground and are a minor term for a deep station.
- Elevator Machine Room Cooling: an adjacent case of removing heat from equipment inside a station, and part of what the lighting and equipment field is holding.
- AC Tonnage Calculator: conversion of a heat load into refrigeration capacity, the same 12,000 BTU/h per ton the page applies to the total.
- CFM Calculator: the airflow needed to carry away a given heat load at a given temperature rise, which is the check applied to the offset above.
- Fan Power Calculator: the absorbed power of the station fans, which becomes part of the equipment term wherever the motors sit inside the station volume.
- Velocity Pressure Calculator: the dynamic pressure behind the air velocities measured in shafts and at the platform edge, where the piston effect is a comfort limit.