The Calculator Asks for the Number Nobody Has Yet
The page takes a required airflow as an input and returns the average velocity that airflow produces in a stated cross-section. The quantity carrying all of the engineering is therefore the one the user has to bring with them, and it has to be settled somewhere else before the calculator can be opened at all.
That is a division of labour rather than a shortcoming. Establishing the required airflow for a road tunnel is not one calculation. It is at least two, they proceed from unrelated physical arguments, and they routinely differ by an order of magnitude. One asks how much air is needed to hold the pollutant concentration and the visibility inside acceptable limits while traffic runs normally. The other asks how fast the air has to move along the tunnel to stop smoke from a fire travelling upstream against it. The same fans have to satisfy both, and the larger of the two decides what gets installed.
A tunnel also changes the dilution problem itself. The parking garage article treated dilution in an enclosed volume with no air movement of its own, where the only thing moving air is a fan. Moving traffic drags air along with it, so a busy tunnel ventilates itself to a degree that can leave the fans idle for most of the year. That free ventilation then disappears in a traffic jam, at the moment when the emission per unit length is at its highest and the vehicles are stationary with their engines running.
This article covers where the required airflow comes from in each of the two cases, why the velocity the calculator returns cannot by itself say which case produced it, and what becomes of the piston effect when the traffic stops. The calculator sits at the end of that chain, converting whichever airflow the design case produced into the velocity that tunnel standards are actually written against.
Calculator Inputs: An Airflow You Bring and an Area That Interprets It
Two numeric fields and a unit toggle, one of which does all the work and neither of which the page can supply for you.
Unit System. Imperial (CFM, ft²) or Metric (m³/s, m²).
Required Tunnel Airflow [CFM or m³/s]. The airflow for whichever design case is under consideration. This value arrives from outside the page, from a dilution calculation for normal operation or from a critical velocity requirement for smoke control.
Tunnel Cross-Sectional Area [ft² or m²], optional. The clear area through which the air actually passes. A two-lane road tunnel runs 50 to 70 m² (540 to 750 ft²), while a three-lane bore or one built to an enlarged gauge runs 80 to 110 m² (860 to 1,180 ft²).
Outputs are the ventilation rate, the average velocity at the stated area, and an interpretation category.
What the first step actually does:
The ventilation rate is returned unchanged: the value entered by the
user comes back as a result. That is a carry-through rather than a
calculation, so that the category and the velocity both refer to one
named quantity. The only computed quantity on the page is the
average velocity.
Which area to enter:
The clear area of the air path, not the excavated profile.
Equipment under the crown, a suspended ceiling forming an exhaust
duct, and maintenance walkways all reduce the free area, and the
velocity is set by what is left.
What the calculation does not do: it does not establish the required airflow, does not distinguish normal from emergency operation, and does not model the piston effect, portal pressure differences, system pressure loss, jet fan performance or the behaviour of a smoke layer.
Velocity Is the Quantity Standards Are Written Against
The calculator converts an airflow into a velocity, and that conversion matters because tunnel requirements are almost always expressed as velocities rather than as volumetric flows.
Imperial: V [fpm] = Q [CFM] / A [ft²]
Metric:   V [m/s] = Q [m³/s] / A [m²]

Q = required airflow, 50,000 to 600,000 CFM (24 to 285 m³/s)
A = clear cross-sectional area, 540 to 1,180 ft² (50 to 110 m²)
V = average longitudinal velocity, 200 to 600 fpm (1 to 3 m/s)
Why the requirements are written that way:
Critical velocity is a velocity by definition: it states how fast the
air has to move before smoke stops spreading against the flow.
The upper limit set by evacuation conditions is also a velocity,
because it concerns a person walking along the tunnel.
The airflow depends on the cross-section and by itself says nothing
about safety.
What that means when a result is read:
The same airflow in a 50 m² (540 ft²) tunnel and in a 110 m²
(1,180 ft²) tunnel gives velocities differing by more than a factor
of two.
255 m³/s (540,300 CFM) through 50 m² is 5.10 m/s (1,004 fpm).
The same airflow through 110 m² is 2.32 m/s (457 fpm).
The first approaches the upper limit for evacuation conditions,
the second sits near the lower end of the critical velocity range.
Why the category bands are of limited use:
The category is assigned on the absolute airflow, without reference
to cross-section or length. It answers a question about the scale of
the installation rather than about the adequacy of the ventilation.
The bands are preliminary and do not derive from PIARC, FHWA or
NFPA requirements.
Per PIARC Road Tunnels Manual and NFPA 502: tunnel ventilation requirements are expressed as longitudinal air velocities, because both the critical velocity for smoke control and the upper limit for evacuation conditions are defined in terms of air movement rather than volume flow.
Two Design Cases Sharing One Fan System
A tunnel ventilation system is sized twice, once for the air it must move while traffic runs and once for the air it must move while something burns, and the larger of the two governs the installation.
Normal operation:
The task: hold pollutant concentration and visibility within limits.
The quantity: an airflow following from the emission and the
allowable rise.
The design case: peak traffic volume, and separately the congested
condition at low speed.
Emergency operation:
The task: prevent smoke spreading against the flow, so that the
tunnel on one side of the incident stays usable for evacuation and
for the fire service.
The quantity: a velocity following from the fire size and the
geometry.
The design case: an assumed design fire, commonly from a few tens of
megawatts to around one hundred and fifty, depending on the vehicle
mix the tunnel is permitted to carry.
Why the fire case usually wins:
Diluting the exhaust of a modern vehicle fleet takes substantially
less air than holding back smoke, because specific emissions have
fallen by an order of magnitude over recent decades while the heat
release rate of a burning lorry has not moved at all.
Sections six and eight put both figures against one another for the
same tunnel.
What that means for the equipment:
Fans are selected on the emergency case and then run in the normal
case, or do not run at all, for almost the whole of their life.
They also have to keep working in hot smoke for a specified period,
which is a requirement on construction and certification rather than
on capacity.
Per PIARC Road Tunnels Manual and NFPA 502: ventilation capacity for normal operation and ventilation capacity for fire scenarios are separate design cases, and the fire case commonly governs the installed capacity while the normal case governs day to day operation.
Normal Operation: Dilution Against Traffic Emission
The normal case is the same dilution balance the garage calculation uses, with the source strength built from traffic volume, tunnel length and an emission factor per vehicle kilometre.
Setting up the source:
G = N × L × e

G = pollutant release rate, g/h
N = traffic volume, vehicles/h, typically 500 to 6,000
L = tunnel length, km, typically 0.2 to 5 (0.12 to 3.1 mile)
e = emission factor, g/km per vehicle
The dilution airflow:
Q = G / (ρ_CO × Δc)

ρ_CO = 1.164 kg/m³ (0.0727 lb/ft³) at 20 °C (68 °F)
Δc   = allowable concentration rise, volume fraction
Worked through for a representative tunnel:
Length 1 km (0.62 mile, 3,281 ft), 3,000 vehicles/h,
emission factor 1 g/km, allowable rise 30 ppm:

G = 3,000 × 1 × 1 = 3,000 g/h = 0.833 g/s
Volume flow of CO: 0.833 / 1,164 = 7.16 × 10⁻⁴ m³/s
Q = 7.16 × 10⁻⁴ / (30 × 10⁻⁶) = 23.9 m³/s (50,600 CFM)
What sets the emission factor:
Fleet composition, vehicle age, the standards in force when those
vehicles were built, the diesel share, and the driving regime.
The figure has fallen by an order of magnitude over several decades
on the back of catalytic conversion, and it continues to fall as
fleets renew.
Design values are taken from data current at the time of design
rather than from an older reference.
Gradient:
A climb raises engine load and emission, a descent lowers both.
The calculation is carried out for the uphill direction of travel,
and for a bidirectional tunnel for the worse of the two.
Per PIARC Road Tunnels Manual and ASHRAE Handbook, HVAC Applications (2023), Chapter 16: the normal operation airflow follows from traffic volume, tunnel length, an emission factor per vehicle kilometre, and the allowable concentration rise, with emission factors falling substantially as vehicle fleets renew.
Where Visibility Governs Instead of Carbon Monoxide
In most modern road tunnels the pollutant that sets the normal operation airflow is not carbon monoxide but the particulate matter that obscures vision, because visibility requirements have not relaxed while carbon monoxide emission has.
How the requirement is written:
The limit is expressed through a light extinction coefficient per
unit length, which describes how quickly contrast is lost with
distance along the tunnel.
Separate values apply to normal operation, to congested conditions,
and to the threshold at which the tunnel is closed.
Why visibility overtook carbon monoxide:
Catalytic conversion cut the carbon monoxide emission of petrol
engines by an order of magnitude, while particulate emission from
diesel engines fell more slowly and later.
An airflow sufficient for carbon monoxide therefore often leaves
visibility below what is required, and visibility becomes the
governing balance.
What the fleet decides:
The diesel share of the traffic settles which of the two pollutants
governs.
A tunnel on a route carrying heavy freight is designed on visibility
in almost every case.
The connection to oxides of nitrogen:
The same shift applies to nitrogen dioxide, whose emission from
diesel engines is substantially higher and whose limit
concentrations are numerically lower than those for carbon monoxide.
The problem becomes multi-component, and the most demanding of the
balances is the one that governs.
Per PIARC Road Tunnels Manual: visibility requirements expressed through a light extinction coefficient commonly govern normal operation ventilation in modern road tunnels, because carbon monoxide emission has fallen substantially while particulate emission from diesel vehicles has not fallen in the same proportion.
Fire: Critical Velocity and the Iteration Behind It
The fire case is set by the critical velocity, the longitudinal air speed at which smoke stops propagating upstream against the flow, and it comes from a relation that has to be solved by iteration because the answer appears on both sides of it.
V_c = K₁ × K_g × [g × H × Q_c / (ρ × c_p × A × T_f)]^(1/3)
T_f = Q_c / (ρ × c_p × A × V_c) + T_a

V_c = critical velocity, m/s, typically 2 to 3.5 (390 to 690 fpm)
K₁  = 0.606, empirical coefficient, dimensionless
K_g = gradient correction, 1.0 for a level tunnel
g   = 9.81 m/s² (32.2 ft/s²)
H   = tunnel height, m, typically 4 to 8 (13 to 26 ft)
Q_c = convective heat release rate, W,
      typically 30 × 10⁶ to 150 × 10⁶
ρ   = 1.2 kg/m³ (0.075 lb/ft³), c_p = 1,005 J/(kg·K)
A   = cross-sectional area, m², typically 50 to 110
      (540 to 1,180 ft²)
T_a = ambient air temperature, K, here 293 K (20 °C, 68 °F)
T_f = smoke gas temperature, K
Why an iteration is needed:
The gas temperature depends on the velocity at which the smoke is
diluted, and the velocity depends on the temperature. The solution
is found by successive approximation and settles within a few steps.
Solved for the cross-section of the page example:
A = 85 m² (915 ft²), H = 6 m (19.7 ft), T_a = 293 K, level tunnel:

Q_c =  30 MW: V_c = 2.07 m/s (407 fpm), Q = 176 m³/s (372,900 CFM)
Q_c = 100 MW: V_c = 2.69 m/s (530 fpm), Q = 229 m³/s (485,200 CFM)
Q_c = 150 MW: V_c = 2.88 m/s (567 fpm), Q = 245 m³/s (519,100 CFM)
What the numbers show:
Multiplying the fire size by five raises the critical velocity by
about forty percent, because it enters under a cube root.
The required airflow stays within one order of magnitude across the
whole range, so the choice of design fire moves the result
considerably less than might be expected.
What selects the fire size:
The vehicle mix the tunnel is permitted to carry. A car is of the
order of 5 MW, a bus or van some tens of megawatts, a heavy goods
vehicle with a combustible load more than a hundred.
The value is assigned by the project and agreed with the authority
rather than derived from a calculation.
The upper bound:
Velocity is limited from above by evacuation conditions: moving air
makes walking difficult and helps to destroy the smoke layer.
The practical limit is around ten metres per second (1,970 fpm), and
it is rarely reached in a longitudinal road tunnel scheme.
Per NFPA 502 and the Kennedy correlation: critical velocity follows from the convective heat release rate, tunnel height, and cross-sectional area through a relation solved iteratively because the smoke gas temperature and the velocity are mutually dependent.
Why Velocity Alone Does Not Identify the Operating Case
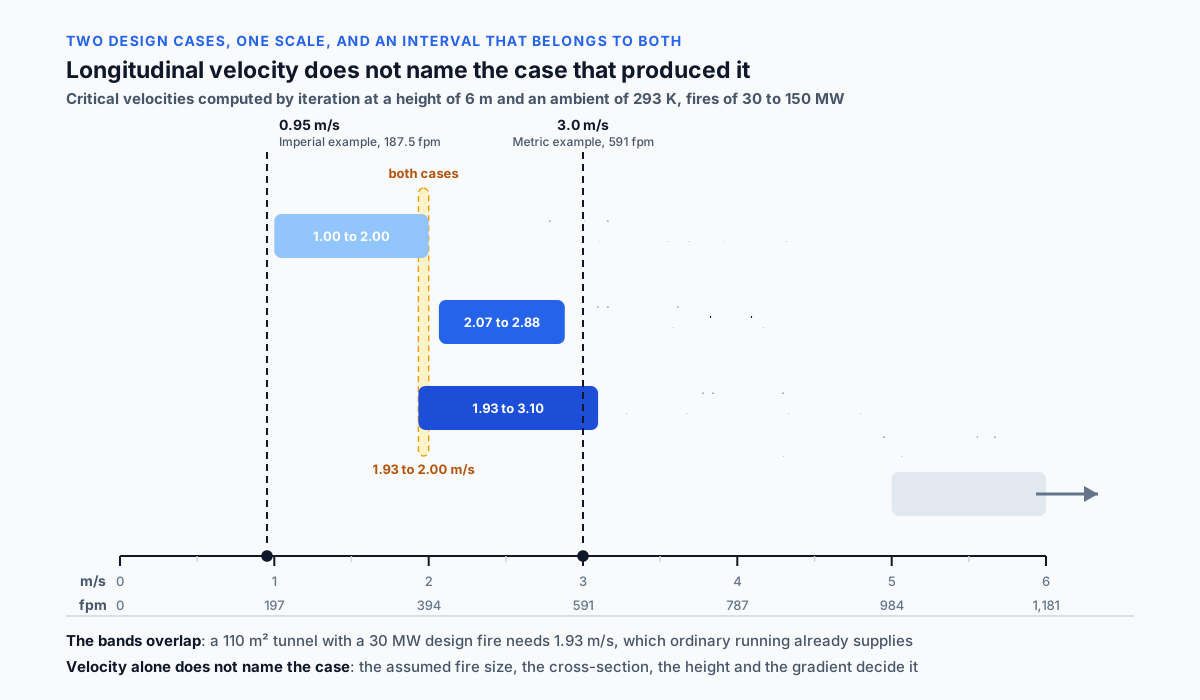
The velocity a calculation returns does not by itself say which design case produced it, because the ranges for normal operation and for smoke control sit close together and overlap once tunnel geometry is allowed to vary.
The ranges:
Normal longitudinal operation: about 1 to 2 m/s (197 to 394 fpm)
  from FHWA material, depending on the traffic pattern and the
  ventilation strategy.
Critical velocity at 85 m² (915 ft²) and 6 m (19.7 ft) height:
  2.07 m/s (407 fpm) at 30 MW to 2.88 m/s (567 fpm) at 150 MW.
Upper limit from evacuation conditions: around 10 m/s (1,970 fpm).
Where the ranges meet:
A smaller cross-section raises the critical velocity, a larger one
lowers it. The same 30 MW fire needs 2.35 m/s (462 fpm) in a 50 m²
(540 ft²) tunnel and 1.93 m/s (380 fpm) in a 110 m² (1,180 ft²) one,
and the second figure is already inside the normal operation range.
One velocity in two tunnels of different section means two different
things.
What has to be known besides the velocity:
The cross-sectional area and the height, because both enter the
critical velocity directly.
The assumed design fire.
The gradient, which raises the velocity required when smoke travels
uphill.
The design case the figure was produced for.
How to read the examples on the page:
The metric example gives 3.0 m/s (591 fpm), above the critical
velocity range quoted for this cross-section at fire sizes up to
150 MW, and well above the normal operation range.
Such a velocity may correspond to the emergency case at a larger
design fire, on a gradient, or with a more conservative approach,
but one velocity figure is not enough to conclude which.
The imperial example gives 0.95 m/s (187.5 fpm), closer to normal
operation, though here too the required value has to follow from a
calculation on emission and traffic rather than from an observation
of velocity.
Per FHWA Technical Manual and NFPA 502: normal operation longitudinal velocities and critical velocities for smoke control occupy adjacent ranges that overlap as tunnel geometry varies, so a velocity figure has to be accompanied by the case and the geometry it was derived for.
The Piston Effect Pays for Ventilation Until the Traffic Stops
Moving vehicles drag air along the tunnel with them, and in a busy tunnel with unidirectional traffic that effect alone can produce the longitudinal velocity normal operation requires, leaving the fans idle for most of the year.
Where the effect comes from:
Every vehicle overcomes aerodynamic drag and hands the air an equal
force in the direction of travel.

F = (ρ / 2) × C_d A × (V_veh − V_air)²

C_d A = drag coefficient times frontal area, m² (ft²),
        about 0.7 m² (7.5 ft²) for a car and 3 to 5 m²
        (32 to 54 ft²) for a heavy goods vehicle
V_veh = vehicle speed, m/s (fpm)
V_air = air speed, m/s (fpm)
Worked through for the same tunnel:
Length 1 km (3,281 ft), area 85 m² (915 ft²),
3,000 vehicles/h at 20 m/s (72 km/h, 45 mph),
air speed 3 m/s (591 fpm):

Transit time: 1,000 / 20 = 50 s
Vehicles in the tunnel: 3,000 × 50 / 3,600 = 41.7
Force per vehicle: 0.6 × 0.7 × (20 − 3)² = 121 N (27 lbf)
Total force: 41.7 × 121 = 5,050 N (1,135 lbf)
Pressure rise: 5,050 / 85 = 59 Pa (0.24 in w.g.)
Set against jet fans:
A typical jet fan develops on the order of eight hundred newtons
(180 lbf) of thrust once the installation factor for mounting close
to the crown is applied.
The traffic in the calculation above is equivalent to about six such
fans running continuously and at no cost.
What it depends on:
A unidirectional tunnel gets the whole of the piston effect.
In a bidirectional tunnel the opposing streams partly cancel, and
the net longitudinal flow is close to zero.
That is why longitudinal ventilation is used mainly in tunnels with
unidirectional traffic.
Per FHWA Technical Manual and PIARC Road Tunnels Manual: moving traffic imparts momentum to the tunnel air in proportion to the square of the relative velocity, and in a unidirectional tunnel with dense fast traffic the piston effect can supply the longitudinal airflow that normal operation requires.
The Congestion Case Removes the Piston and Raises the Source
A traffic jam is the design case in which the two halves of the problem move in opposite directions at once, and it is the reason a tunnel that ventilates itself for most of the year still needs a full fan installation.
What happens to the piston:
The force goes with the square of the velocity difference.
With the traffic stationary that difference becomes the air velocity
with its sign reversed, and the standing vehicles start to retard the
flow instead of driving it.
The free ventilation does not merely disappear, it changes sign.
What happens to the source:
Vehicle density rises several times over. A stream at 20 m/s
(45 mph) holds about forty two vehicles in a kilometre of tunnel,
while a jam at seven metre (23 ft) spacing across two lanes holds
about two hundred and eighty six.
Idling emission per vehicle is lower than emission in motion, but
not by a factor of seven, so the emission per unit length is higher
in the jam.
The coincidence of the two:
The maximum of the source falls exactly on the minimum of the
tunnel's own ventilation. The normal operation calculation is
therefore carried out for the congested condition rather than for
free flowing traffic, and that case sets the installed fan capacity
for normal operation.
Why congestion does not replace the fire case:
The airflow required in a jam stays below the airflow required to
hold back smoke, because the emission of a modern fleet is an order
of magnitude smaller in its effect than the heat release rate of a
fire.
Congestion governs normal operation, and fire governs the
installation.
Per PIARC Road Tunnels Manual and FHWA Technical Manual: congested traffic removes the piston effect while raising the emission per unit length, so the congestion condition rather than free flowing traffic governs the normal operation ventilation requirement.
Longitudinal Against Transverse: The Strategy Changes the Number
The required airflow depends on how the air is introduced and removed, and the two principal strategies produce different numbers for the same tunnel.
Longitudinal:
Air travels along the tunnel from one portal to the other, driven by
jet fans mounted under the crown. The whole airflow passes through
the full cross-section, and the velocity rises along the length as
emission accumulates.
Simple and inexpensive, used in unidirectional tunnels of moderate
length.
Transverse:
Supply and extract are distributed along the length through ducts,
and the longitudinal velocity stays low. The airflow at any one
section is lower than in a longitudinal scheme of the same length,
but the total system airflow is higher, and dedicated ducts are
needed which take up part of the excavated profile.
Used in long and bidirectional tunnels.
Semi-transverse:
Distributed supply with concentrated extract or the reverse, an
intermediate option in cost and in controllability.
What changes in a fire:
A longitudinal scheme controls the direction of the smoke and has to
reach the critical velocity. A transverse scheme removes smoke
locally through extract openings near the seat of the fire and does
not need a longitudinal flow of the same magnitude, but it does need
controllable dampers and a larger duct cross-section.
The design airflows of the two schemes are not directly comparable.
Per PIARC Road Tunnels Manual and FHWA Technical Manual: longitudinal, transverse, and semi-transverse ventilation strategies produce different airflow requirements for the same tunnel, and the smoke management approach differs correspondingly between them.
Portal Wind and Buoyancy Work Against the Fans
The fans are not the only thing moving air in a tunnel, and the two natural effects that compete with them can exceed the design pressure the system was built to produce.
Portal pressure difference:
A difference in atmospheric pressure between the two portals arises
from wind and from the difference in elevation. It can reach several
tens of pascals (on the order of 0.1 to 0.2 in w.g.) and changes
sign with the weather. For comparison, the piston effect in the
calculation above produced 59 Pa (0.24 in w.g.).
Thermal head:
In a tunnel on a gradient the air heated by a fire develops a
buoyancy force that drives smoke up the slope regardless of what the
fans are doing.
The effect grows with fire size and with gradient, and is carried by
the correction coefficient in the critical velocity relation.
Why this matters to the calculation:
The required fan thrust is the sum of the tunnel resistance, the
opposition to the portal pressure difference and, in the emergency
case, the work against the thermal head. The airflow itself does not
change, while the installed thrust required to achieve it rises.
What is done in practice:
The direction of longitudinal flow in a fire is chosen with the
gradient in mind, driving smoke uphill where possible, so that the
natural head helps rather than hinders.
The system is checked against the unfavourable combination of portal
wind and gradient.
Per PIARC Road Tunnels Manual and the Memorial Tunnel Fire Ventilation Test Program: portal pressure differences and buoyancy on a gradient act on the tunnel air independently of the fans, and the required fan thrust must overcome them in addition to the tunnel resistance.
Worked Example: 255 Cubic Metres per Second Through 85 Square Metres
The scenario matches the Metric example on the calculator page.
Required airflow 255 m³/s (540,300 CFM)
Cross-sectional area 85 m² (915 ft²)
Step 1. Ventilation rate.
The value is carried through unchanged: 255 m³/s (540,300 CFM).
It came from a calculation on whichever case the designer is
considering, and the calculator does not establish it.
Step 2. Average velocity.
V = 255 / 85 = 3.0 m/s (591 fpm)
Step 3. Category.
255 m³/s corresponds to 540,300 CFM, above the upper bound of the
HIGH band at 300,000 CFM (141.6 m³/s).
Category: VERY HIGH.
Step 4. What the category means.
The band describes the scale of the installation rather than the
adequacy of the ventilation. It takes no account of cross-section,
length or operating case, and it is preliminary rather than derived
from PIARC, FHWA or NFPA requirements.
Step 5. Against the normal operation case.
The dilution calculation for a 1 km (0.62 mile) tunnel at 3,000
vehicles/h and an emission factor of 1 g/km gave 23.9 m³/s
(50,600 CFM).
The 255 m³/s entered is more than ten times that figure, which
points to a different design case.
Step 6. Against the critical velocity.
For 85 m² (915 ft²) at 6 m (19.7 ft) height the critical velocity
runs from 2.07 m/s (407 fpm) at 30 MW to 2.88 m/s (567 fpm) at
150 MW, corresponding to 176 to 245 m³/s (372,900 to 519,100 CFM).
The 255 m³/s lies above that range, consistent with a larger design
fire, with a gradient, or with an allowance carried on top.
Step 7. What the comparison does not prove.
Neither comparison establishes which case the value was produced
for. A velocity of 3.0 m/s does not name the regime, and the
conclusion requires the design fire, the height, the gradient and
the chosen strategy.
Step 8. Check the area.
The 85 m² has to be the clear air path. A suspended ceiling forming
an exhaust duct, or equipment under the crown, reduces it, and the
same airflow then produces a higher velocity.
Reducing the section to 70 m² (753 ft²) raises the velocity to
3.64 m/s (717 fpm).
Step 9. The upper limit.
The 3.0 m/s obtained stays well below the practical limit of around
10 m/s (1,970 fpm), beyond which air movement begins to impede
evacuation.
Step 10. What to do next.
Establish which design case the value came from, and check it with
the calculation belonging to that case.
Determine the required fan thrust from the tunnel resistance, the
portal pressure difference and the gradient.
Confirm that normal operation under congested traffic is also
covered.
Imperial Example and the Regime It Suggests
The scenario matches the Imperial example on the calculator page.
Required airflow 180,000 CFM (85.0 m³/s)
Cross-sectional area 960 ft² (89.2 m²)

V = 180,000 / 960 = 187.5 fpm (0.95 m/s)
Category: 180,000 CFM falls inside the band 150,000 to 300,000
          → HIGH
Checking that the two unit systems agree:
The same case in metric quantities:
180,000 × 0.000472 = 85.0 m³/s
960 × 0.092903 = 89.2 m²
85.0 / 89.2 = 0.953 m/s
against 187.5 × 0.00508 = 0.953 m/s
The agreement confirms that the conversion factors are consistent.
Which regime the value suggests:
A velocity of 0.95 m/s (187.5 fpm) sits near the lower end of the
normal longitudinal operation range that FHWA material gives as
roughly 1 to 2 m/s (197 to 394 fpm).
That is closer to a dilution basis than to an emergency one, though
the required value must in any case follow from a calculation on
emission and traffic volume rather than from an observation of
velocity.
Comparing the two examples:
The cross-sections are close: 85 against 89.2 m²
(915 against 960 ft²).
The airflows differ threefold: 255 against 85.0 m³/s
(540,300 against 180,000 CFM).
The velocities differ by the same ratio: 3.0 against 0.953 m/s
(591 against 187.5 fpm).
One tunnel under two different design cases produces figures three
times apart, and both categories still land in the upper half of the
scale.
What that comparison shows:
The category bands do not separate the regimes. A value belonging to
normal dilution and a value belonging to smoke control both receive
high categories, because the absolute airflow in a tunnel is large
either way.
The category speaks to the scale of the installation, and to nothing
else.
Per FHWA Technical Manual: normal operation longitudinal velocities are commonly in the range of one to two metres per second (197 to 394 fpm), so a velocity below that range suggests a normal operation basis, though the required airflow itself must come from the pollutant and traffic calculation rather than from the velocity.
Application Boundaries: Transients, Modelling, Life Safety
The scope of the model is the conversion of a stated airflow into an average sectional velocity, and the placement of that airflow in a preliminary band. Everything below sits outside it.
Establishing the required airflow. The calculator does not find it. The value follows from a dilution calculation for normal operation and from a critical velocity requirement for the fire case, and both are carried out separately.
Velocity distribution over the section. An average is returned, while the real velocity field is uneven because of geometry, equipment under the crown, local resistances and the jets from the fans themselves.
The piston effect. Not modelled, although in a unidirectional tunnel with dense traffic it can cover normal operation on its own.
Portal pressure difference and thermal head. Both act on the air independently of the fans and bear on the thrust required.
Pressure loss and fan selection. An airflow determines neither the tunnel resistance, nor the number and spacing of jet fans, nor the thrust they have to develop.
Smoke layer behaviour. Stratification, its destruction at higher velocity, and backlayering under the crown are described by modelling rather than by an average velocity.
Transient conditions. The figure is a steady one, while both traffic flow and fire growth are unsteady.
Tunnel networks. Junctions, ramps and ventilation shafts form a network whose behaviour does not reduce to a single cross-section.
Compliance. The result does not demonstrate conformity with NFPA 502, PIARC or the requirements of a jurisdiction, and is not a life safety justification.
Per PIARC Road Tunnels Manual, NFPA 502, and FHWA Technical Manual: converting a stated airflow into an average sectional velocity is the scope of this model, while establishing the required airflow, smoke layer behaviour, fan thrust, transient response, and life safety demonstration require dedicated analysis.
Tunnel Ventilation Rate Calculator
Tunnel ventilation rate by sectional velocity: it takes an airflow established elsewhere, carries it through unchanged, and divides it by the tunnel cross-sectional area to give the average longitudinal velocity, then places the airflow in a preliminary size band. The velocity is the quantity tunnel standards are written against, while the airflow behind it comes from either a dilution calculation for normal traffic or a critical velocity requirement for smoke control. A screening conversion, not a determination of the required ventilation and not a life safety demonstration.
Open Tunnel Ventilation Rate CalculatorStandards and References
- PIARC Road Tunnels Manual, Ventilation Design and Dimensioning. Separation of the normal operation and fire design cases, air quality and visibility requirements, and the selection of a ventilation strategy.
- PIARC Road Tunnels Manual, Tunnel Ventilation System. Longitudinal, transverse and semi-transverse schemes, equipment, and control of the longitudinal flow.
- NFPA 502 (2023), Standard for Road Tunnels, Bridges, and Other Limited Access Highways. Emergency ventilation requirements, critical velocity, and design fire heat release rates.
- FHWA-NHI-10-034 (2009), Technical Manual for Design and Construction of Road Tunnels, Civil Elements. Normal operation design velocities, the piston effect, portal phenomena, and the associated calculation procedures.
- ASHRAE Handbook, HVAC Applications (2023), Chapter 16, Enclosed Vehicular Facilities. Ventilation design methods for road tunnels and other enclosed transport facilities.
- ASHRAE TC 5.9, Enclosed Vehicular Facilities. The technical committee maintaining design methods for tunnels and underground transport structures.
- Memorial Tunnel Fire Ventilation Test Program (1995), Massachusetts Highway Department and Bechtel/Parsons Brinckerhoff. Full scale tests of longitudinal and transverse ventilation against fires of various sizes, which underpin much of the subsequent guidance.
- Kennedy, W. D. (1996), Critical Velocity: Past, Present and Future. Derivation of the relation between convective heat release rate, tunnel geometry and the velocity at which backlayering of smoke ceases, together with the limits of its applicability.
- Thomas, P. H. (1968), The Movement of Smoke in Horizontal Passages Against an Air Flow, Fire Research Station. The earlier treatment of buoyant smoke opposing a longitudinal flow from which the critical velocity concept develops.
- Manufacturer data for tunnel jet fans. Developed thrust, installation factor for mounting close to the crown, spacing, and certification for operation in hot smoke.
FAQ
How is the required tunnel ventilation rate determined?
Per PIARC Road Tunnels Manual: by two separate calculations. Normal operation follows a dilution balance built from traffic volume, tunnel length, an emission factor per vehicle kilometre, and the allowable concentration or visibility limit. The fire case follows from the critical velocity needed to prevent smoke moving upstream. The larger of the two governs the installed capacity.
What is critical velocity?
Per NFPA 502 and the Kennedy correlation: the longitudinal air velocity at which smoke from a fire stops propagating against the airflow, leaving one side of the incident clear for evacuation. It follows from the convective heat release rate, tunnel height and cross-sectional area through a relation solved iteratively, and for a tunnel of 85 m² and 6 m height it runs from about 2.1 m/s (410 fpm) at 30 MW to about 2.9 m/s (570 fpm) at 150 MW.
Can a velocity figure tell me which design case it came from?
Per FHWA Technical Manual and NFPA 502: not on its own. Normal operation velocities of one to two metres per second (197 to 394 fpm) sit adjacent to critical velocities that vary with tunnel geometry, and the two ranges overlap as the cross-section changes. Identifying the case requires the geometry, the assumed fire size, and the basis the figure was derived from.
Does moving traffic ventilate a tunnel by itself?
Per FHWA Technical Manual: to a considerable degree in a unidirectional tunnel. Vehicles impart momentum to the air in proportion to the square of the relative velocity, and dense traffic at 20 m/s (45 mph) through a one kilometre tunnel can generate a pressure rise on the order of 60 Pa (0.24 in w.g.), comparable to several jet fans running continuously.
Why does congestion govern the normal operation case?
Per PIARC Road Tunnels Manual: because it removes the piston effect and raises the emission per unit length at the same time. Stationary vehicles no longer drive the air and begin to obstruct it, while the number of engines running in a given length of tunnel multiplies several times over.
Is carbon monoxide still the governing pollutant?
Per PIARC Road Tunnels Manual: often not. Catalytic converters have reduced carbon monoxide emission by an order of magnitude while particulate emission from diesel vehicles has fallen less, so visibility expressed through a light extinction coefficient commonly governs normal operation in modern tunnels, with nitrogen dioxide a further consideration.
Does this calculator demonstrate compliance with NFPA 502?
Per NFPA 502 and PIARC guidance: no. It converts a stated airflow into an average velocity and places the airflow in a preliminary band. Compliance depends on the full operating scenario, the smoke management strategy, fan thrust and reliability, and the requirements of the jurisdiction.
Related Calculators
- Parking Garage CO Ventilation: Dilution of the same pollutant in an enclosed volume with no air movement of its own, where the piston effect is absent by definition (article).
- Mine Ventilation Airflow: An underground excavation with distributed sources and a network of airways, which is the tunnel problem with the traffic replaced by equipment.
- Fan Power Calculator: The power required to move the calculated airflow against the resistance of the air path, which is the next question once the airflow itself is settled.
- Static Pressure Calculator: The pressure the fans have to develop over and above the portal difference working against them, and the quantity that decides how many jet fans a scheme needs.
- Air Velocity Calculator: The general relation between airflow and velocity that underlies this conversion.
- Duct Velocity Calculator: The same relation for ductwork, where the limits come from noise and pressure loss rather than from evacuation conditions.
- CFM Calculator: Airflow for ordinary occupied rooms, useful for the comparison of scale against a tunnel moving a quarter of a million cubic feet per minute.
- Fan Law Calculator: Rescaling of the operating point when the system runs at a different duty, which is what staged jet fan operation amounts to.