A Garage Is a Dilution Problem With No Setpoint to Hide Behind
Ventilation for occupancy answers to comfort and to a sense of freshness, and getting it slightly wrong produces complaints. Somebody says the room is stuffy, somebody opens a damper, and the system converges on a condition the occupants accept. Ventilation for an enclosed parking garage answers to a poison, and the quantity under control is a concentration that nobody in the space can perceive at the levels that matter.
Carbon monoxide is colourless, odourless, and binds to haemoglobin several hundred times more readily than oxygen does. An occupant walking to a car has no way of knowing whether the concentration around them is 5 ppm or 80 ppm. That removes the feedback loop every other ventilation problem quietly relies on, and it is the reason garage ventilation appears in codes as a numerical limit with sensors attached rather than as a matter left to the judgement of the people in the space.
The direction of the calculation changes as well. The airflow does not follow from a heat balance or from a comfort target. It follows from a source strength divided by an allowable concentration rise, which is a mass balance on a contaminant rather than on energy. Double the traffic and the requirement doubles. Halve the allowable rise and the requirement doubles again. Neither of those relationships has an equivalent in a thermal calculation, where doubling the load doubles the airflow but moving the room setpoint by two degrees does not.
The calculator multiplies floor area by a coefficient, scales it for traffic activity, and scales it again by the ratio of a reference concentration rise to the one the project allows. What comes out is a screening airflow. This article works that model backwards to see what it assumes about vehicle emission, sets the result against the airflow codes prescribe directly, and examines what a steady state calculation cannot describe in a space where the traffic arrives in waves.
Calculator Inputs: Four Fields and a Coefficient You Cannot See
Four numeric fields, a unit toggle, and a fifth quantity that fixes the scale of the answer without appearing anywhere on the page.
Unit System. Imperial (ft², CFM) or Metric (m², m³/h). Concentrations in ppm are dimensionless and carry across unchanged.
Garage Floor Area [ft² or m²]. The enclosed floor area being ventilated. A small attached garage runs 5,000 to 20,000 ft² (460 to 1,860 m²), the underground garage of an office building 50,000 to 200,000 ft² (4,600 to 18,600 m²), and a large transit interchange more than either.
Vehicle Activity Level. Four steps with fixed multipliers: Light 0.70, Moderate 1.00, Heavy 1.50, Very Heavy 2.20. The page pre-selects Moderate.
Incoming CO Concentration [ppm]. The concentration in the outdoor air entering the garage. Suburban sites sit around 0.5 to 2 ppm, dense urban sites around 2 to 5 ppm, and a location beside a busy road higher again.
Target Indoor CO Concentration [ppm]. The steady state ceiling inside the space. Values of 25 to 35 ppm are common, depending on the applicable code edition and the averaging time the limit is written against.
Outputs are the demand category, the activity-adjusted airflow basis, and the required ventilation rate.
The quantity that is not a field:
The base coefficient of 0.10 CFM/ft² (1.83 m³/h·m²) is fixed inside
the model and never appears as an input. It carries the entire
assumption about how fast CO is released per unit of floor area,
and it sets the scale of every result the page returns.
The next section but one works out what stands behind it.
A note on the interface. Step four of the printed instructions asks for a CO generation factor, and no such field exists among the inputs. The coefficient is fixed for each unit system and does not need to be entered.
What the model leaves out: it does not distinguish ceiling height, ramp geometry, the diesel share of the fleet, cold starts, or air distribution, it does not treat transient conditions, and it does not check compliance with anything.
The Model Is a Mass Balance in Disguise
The formula printed on the page reads like a coefficient lookup. Rearranging it exposes the dilution balance underneath, and that is what makes its assumptions checkable against something outside the calculator.
As published:
Imperial: Q = A × 0.10 × F × (25 / max(Δppm, 5))    [CFM]
Metric:   Q = A × 1.83 × F × (25 / max(Δppm, 5))    [m³/h]

A     = floor area, ft² or m², typically 5,000 to 200,000 ft²
        (460 to 18,600 m²)
F     = activity multiplier, 0.70 to 2.20, dimensionless
Δppm  = TargetCO − IncomingCO, ppm, typically 15 to 30 ppm
Collecting the constants:
Q = (A × 0.10 × F × 25) / Δppm
Q = (A × 2.5 × F) / Δppm        [CFM, with Δppm in ppm]
That is a shape with a name:
Classical dilution is written Q = G / Δc, where G is the rate at
which the contaminant is released and Δc the allowable rise in
concentration. The numerator A × 2.5 × F occupies the position of G
and carries the units of CFM·ppm.
Since ppm is parts per million by volume, the numerator converts directly into a volumetric flow of pure CO:
V_CO = (A × 2.5 × F) × 10⁻⁶     [CFM of pure CO]

For a 120,000 ft² (11,148 m²) garage at moderate activity:
V_CO = 120,000 × 2.5 × 1.0 × 10⁻⁶ = 0.30 CFM (0.51 m³/h)
Why the rearrangement earns its keep:
The emission assumption stops being a hidden coefficient and becomes
a quantity that can be set against vehicle emission data and against
the traffic the garage is expected to carry.
Three properties confirm the reading:
Airflow is inversely proportional to the allowable rise, which holds
  for any dilution problem.
Airflow is linear in floor area, because emission is taken as
  proportional to area.
Airflow is linear in the activity multiplier, because that multiplier
  scales the emission directly.
Per ASHRAE Handbook, HVAC Applications (2023), Chapter 16: garage ventilation follows a contaminant dilution balance in which the required airflow is the emission rate divided by the allowable concentration rise, and a coefficient per unit floor area is a compact way of expressing an assumed emission density.
What the Coefficient Implies About Vehicle Emission
A volumetric figure of 0.30 CFM (0.51 m³/h) of pure CO is hard to weigh against anything. Converting it to a mass rate produces a number that vehicle emission data can be compared with directly, and the comparison is worth making because every result the page returns scales from it.
Density of CO at 20 °C (68 °F) and atmospheric pressure:
M = 28.01 g/mol, molar volume 24.06 L/mol
ρ = 28.01 / 24.06 = 1.164 kg/m³ (0.0727 lb/ft³)

For the example garage: 0.51 m³/h × 1.164 = 0.594 kg/h ≈ 594 g/h
Per unit of floor area:
594 g/h ÷ 11,148 m² = 0.053 g/h·m² (0.0049 g/h·ft²)
Set against the traffic:
A 120,000 ft² (11,148 m²) garage holds on the order of 300 to 400
spaces. If about forty vehicles arrive and leave in the peak hour,
the coefficient allots roughly fifteen grams of CO to each one,
covering the manoeuvre out of the space and the drive to the exit.
That is the right order of magnitude for a modern petrol car on a
cold start at low speed, before the catalyst reaches working
temperature.
Where the assumption is fragile:
The proportion of cold starts decides a great deal. The morning
departure from a residential garage is almost entirely cold starts,
while the evening arrival is warm engines throughout.
Fleet age moves the specific emission by a factor of several.
Ramp gradient and floor-to-floor height change engine load.
None of these enters the coefficient, and the activity multiplier
stands in for all of them at once.
How to use the number:
Where a project has traffic counts and a view of the fleet, the
equivalent emission can be built up directly and the page coefficient
becomes an order of magnitude check on that build-up. Where those
data do not exist, the coefficient remains a defensible basis for a
first estimate.
Per ASHRAE Handbook, HVAC Applications (2023), Chapter 16 and ASHRAE Research Project 945-RP: garage emission assumptions depend strongly on the proportion of cold starts, fleet age, and ramp geometry, and a single area-based coefficient represents an average over all of them.
The Hyperbola: Halving the Allowable Rise Doubles the Airflow
The allowable rise sits in the denominator, so the relationship between the concentration target and the required airflow is a hyperbola rather than a line. The practical consequence is that tightening the target costs far more than the size of the change suggests.
Q ∝ 1 / Δppm
Against an incoming level of 5 ppm:
Target 50 ppm: Δppm 45, multiplier 25/45 = 0.56
Target 30 ppm: Δppm 25, multiplier 25/25 = 1.00
Target 20 ppm: Δppm 15, multiplier 25/15 = 1.67
Target 15 ppm: Δppm 10, multiplier 25/10 = 2.50
Target 10 ppm: Δppm  5, multiplier 25/5  = 5.00
For the example garage, 120,000 ft² (11,148 m²) at moderate activity:
target 30 ppm →  12,000 CFM ( 20,388 m³/h)
target 20 ppm →  20,000 CFM ( 33,980 m³/h)
target 15 ppm →  30,000 CFM ( 50,970 m³/h)
target 10 ppm →  60,000 CFM (101,941 m³/h)
Moving the target from 30 to 10 ppm multiplies the requirement by five while the target itself moves by 20 ppm.
The incoming concentration acts on the same denominator:
It is subtracted from the target, so it consumes part of the
available rise before the calculation begins. At a target of 20 ppm
an urban background of 5 ppm leaves 15 ppm of headroom where a
suburban 1 ppm leaves 19 ppm, and the airflow requirement is 27%
higher for it. A garage beside a busy road pays that penalty in
every hour it operates.
Where the relationship stops being useful:
As the background approaches the target the denominator approaches
zero and the requirement grows without limit. Dilution with outdoor
air ceases to be a strategy at that point, because the diluent
itself carries the contaminant.
Per the dilution relation: required airflow varies inversely with the allowable concentration rise, so tightening the indoor target from 30 to 10 ppm at an incoming level of 5 ppm multiplies the requirement by five.
The Five ppm Floor Is Numerical Rather Than Physical
The model applies a lower bound of 5 ppm to the allowable rise. That bound is a guard placed around the arithmetic, and it makes no statement about ventilation.
Δppm_effective = max(TargetCO − IncomingCO, 5)
Why it has to be there:
As the allowable rise approaches zero the required airflow approaches
infinity. That is mathematically correct and useless as the output of
a screening tool. The floor keeps the answer finite.
What it conceals:
A case in which the background concentration approaches or exceeds
the target is a substantive signal rather than a numerical nuisance.
It says the problem cannot be solved by outdoor air in any quantity.
What is done in that situation:
Revisit the target, if it was set more conservatively than the
applicable requirement.
Move the intake to a location with a lower background, higher up the
facade or further from the carriageway.
Consider treating the supply air, which for CO is technically
difficult and rarely done.
Recheck the background figure, because a value that close to the
target more often indicates an error in the input data than a real
site condition.
Reading a result that has hit the floor:
If the entered rise is below 5 ppm, the airflow returned is lower
than the unbounded formula would give. The output should then be read
as a lower bound and as an instruction to return to the input data
rather than as a design figure.
Per the calculator's stated basis: the 5 ppm minimum on the allowable rise keeps the model numerically stable, and an input case that reaches the floor indicates that dilution with outdoor air is not by itself a viable strategy at the stated target.
Where the Screening Result Sits Against Prescriptive Code
Codes offer two routes to a garage ventilation rate: a prescriptive airflow per unit of floor area, or a performance case built on contaminant concentration. Setting the screening result against the prescriptive figure shows which of the two regimes the model represents.
The prescriptive route:
Mechanical ventilation of enclosed parking garages under the
International Mechanical Code is set as an airflow per unit of floor
area, with a continuous minimum on the order of 0.05 CFM/ft²
(0.9 m³/h·m²) and a full rate on the order of 0.75 CFM/ft²
(13.7 m³/h·m²) brought on by the CO detection system.
The values and the conditions attached to them depend on the code
edition and the jurisdiction, and are confirmed against the document
governing the project.
What the model returns per unit of area:
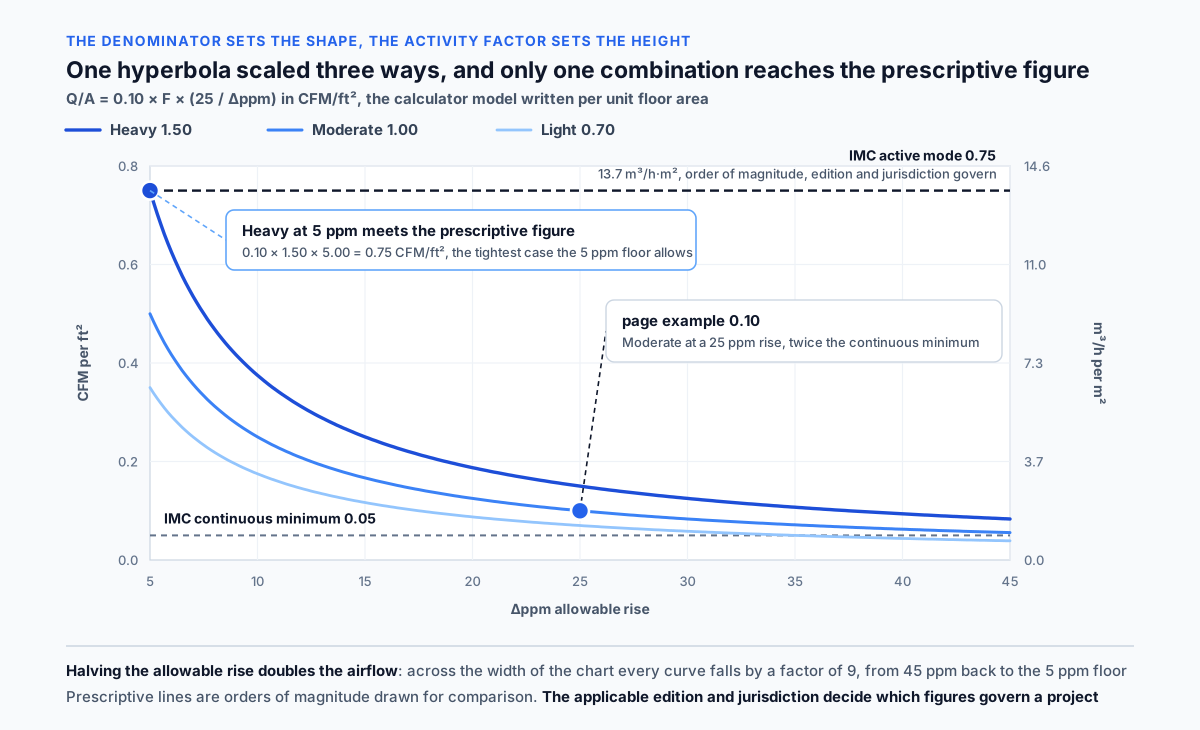
Q/A = 0.10 × F × (25 / Δppm)     [CFM/ft²]

Moderate activity, 25 ppm rise:   0.10  CFM/ft² ( 1.83 m³/h·m²)
Heavy activity, 25 ppm rise:      0.15  CFM/ft² ( 2.74 m³/h·m²)
Heavy activity, 10 ppm rise:      0.375 CFM/ft² ( 6.86 m³/h·m²)
Heavy activity, 5 ppm rise:       0.75  CFM/ft² (13.72 m³/h·m²)
Very heavy activity, 5 ppm rise:  1.10  CFM/ft² (20.12 m³/h·m²)
The coincidence worth noticing:
The model lands exactly on 0.75 CFM/ft² at heavy activity with a
5 ppm rise, the tightest combination its own floor permits.
The page example, moderate activity at a 25 ppm rise, returns
0.10 CFM/ft², seven and a half times below the full prescriptive
rate and twice the continuous minimum.
How to read the comparison:
The model does not describe the same regime as the prescriptive full
rate. It returns the airflow holding a stated steady state
concentration at a stated activity, while the prescriptive figure is
a mode switched on when the detection system calls for it. The two
are not alternative answers to one question.
What follows for a project:
The performance route requires the emission and traffic assumptions
to be defended before the authority having jurisdiction. The
prescriptive route carries no such obligation, which is why it is
used more often where traffic data do not exist. The screening
estimate earns its place by testing whether the prescriptive figure
is plausible on the specific building.
Per the International Mechanical Code garage ventilation provisions and ASHRAE Handbook, HVAC Applications (2023), Chapter 16: enclosed garages may be ventilated by a prescriptive rate per unit area or by a performance approach based on contaminant concentration, and the applicable edition and jurisdiction determine which figures govern.
Steady State Describes an Hour the Garage Rarely Has
The calculation returns the airflow that holds a concentration steady. A garage spends most of its day a long way from any steady condition, because the traffic arrives in waves and the space responds slowly to them.
The time constant of the space:
τ = V / Q

V = garage volume, ft³ or m³, typically 0.5 to 3 million ft³
    (14,000 to 85,000 m³)
Q = ventilation rate, CFM or m³/h
For the example garage:
120,000 ft² (11,148 m²) at a 10 ft (3.05 m) clear height:
V = 1,200,000 ft³ (33,980 m³)
At Q = 12,000 CFM (20,388 m³/h): τ = 100 minutes
Air change rate: 12,000 × 60 / 1,200,000 = 0.6 ACH
What a hundred minutes means:
After a step change in emission the concentration covers about 63%
of the distance to its new steady value in one τ and approaches that
value after three, which here is five hours. The morning departure
peak in a residential garage is far shorter than that.
The immediate consequence:
The steady state concentration the calculation is built around does
not have time to establish itself during the peak. The actual maximum
comes out below the calculated one whenever the peak is shorter than
the time constant, which makes the steady state result conservative
for short peaks.
The other side of the same inertia:
Concentration decays as slowly as it rises. In a garage with several
peaks in a day it may not return to background between them, and the
accumulation from successive waves is outside anything a steady state
calculation describes.
What the prescriptive rate changes:
At 0.75 CFM/ft² the same garage receives 90,000 CFM (152,911 m³/h),
which gives τ near 13 minutes and 4.5 ACH. A system with that time
constant tracks a peak instead of smoothing it, and tracking is the
behaviour sensor based control is built around.
Per ASHRAE Handbook, HVAC Applications (2023), Chapter 16: the response of a garage to a change in emission rate is governed by the ratio of volume to airflow, and traffic peaks shorter than that time constant produce concentrations below the steady state value the design calculation returns.
Codes Limit Averages and Peaks Separately
Carbon monoxide exposure limits are written as a pair, one figure for a sustained average and another for a short excursion. A single target concentration entered into a calculation cannot answer both of them.
How the limits are built:
Occupational health organisations express exposure limits as a
time-weighted average over a working shift and as a ceiling not to be
exceeded over a short interval. Published average values sit broadly
in the range of 25 to 50 ppm depending on the organisation, with
ceilings around 100 ppm, and the concentration considered immediately
dangerous is orders of magnitude above any outdoor background.
The values differ between NIOSH, OSHA and ACGIH, and the ones that
apply to a project are determined by its jurisdiction.
How control in a garage is built:
Detection systems are normally set in two stages, the first raising
or starting ventilation and the second raising an alarm. The
thresholds come from the code and the project, and the staging is
what allows the average to be held low while the system still
responds to peaks.
Why one number is not enough:
The calculation is carried out against a single target concentration,
and that target corresponds to an average rather than a peak. A brief
excursion above it as a queue of vehicles enters is acceptable
against a shift average and may not be acceptable against a ceiling.
What is done about it:
The design target is set below the applicable average limit, leaving
margin for fluctuation.
Detector thresholds are placed so that ventilation increases before
the ceiling value is approached.
The averaging window in the control algorithm is matched to the
averaging time of the limit rather than chosen arbitrarily.
Per NIOSH Pocket Guide to Chemical Hazards and ACGIH Threshold Limit Values: carbon monoxide exposure limits are expressed both as a time-weighted average over a working shift and as a ceiling for short excursions, and the applicable values depend on the jurisdiction.
Sensor Placement Decides What the Control System Believes
A demand controlled garage acts on what its sensors report. Placement therefore decides which concentration the system defends, and the concentration at a convenient mounting position is rarely the concentration at the worst point in the space.
The gap between the two:
A detector near an exhaust grille reads air that has already been
diluted on its way there. A detector on a drive aisle reads something
close to a spatial average. Neither reads the far corner of a
dead-end bay or the queue at the barrier, where engines idle without
moving air past them.
Why more airflow does not close the gap:
The difference between the reading and the worst location is a
distribution problem rather than a volume problem. Raising the total
airflow raises it everywhere the air already goes, which is not where
the discrepancy lives. A garage can carry its full design airflow and
still hold an elevated concentration in a pocket the air never
reaches.
How it is confirmed:
Measurement at commissioning in the locations predicted to be worst,
under a simulated peak rather than at whatever traffic happens to be
present.
Placement of part of the detector count in stagnant zones instead of
all of it where access is easiest.
The connection back to the calculation:
The calculation returns a total airflow and silently assumes complete
mixing. A real garage mixes unevenly, and no distribution
effectiveness term appears anywhere in the model to account for it.
Per ASHRAE Handbook, HVAC Applications (2023), Chapter 16: demand controlled garage ventilation responds to sensor readings, and placement determines whether those readings represent the worst location or the already diluted air near an exhaust point.
Nitrogen Dioxide Can Govern Where the Fleet Is Diesel
Carbon monoxide is the contaminant this calculation addresses. In a garage serving diesel vehicles it is not necessarily the contaminant that sets the airflow.
The difference by engine type:
Petrol engines emit predominantly CO, and most of it during the cold
start.
Diesel engines emit substantially less CO and considerably more
oxides of nitrogen and particulate matter.
Why NO₂ can take over:
Exposure limits for NO₂ are numerically far lower than those for CO,
because its irritant action appears at much smaller quantities. An
airflow sufficient to dilute CO to an acceptable level can leave NO₂
above its own limit, and nothing in a CO calculation will reveal that.
Where this comes up:
Parking at bus stations and depots.
Garages for goods vehicles and municipal fleets.
Underground parking in regions with a high diesel share among
private cars.
How it is handled:
Detectors for both contaminants, with control taken by whichever
reaches its threshold first.
A design airflow set by the more demanding of the two balances.
Many codes require nitrogen dioxide to be considered explicitly for
garages with diesel traffic.
What that leaves the CO calculation:
It remains correct for its own contaminant and becomes a lower bound
on the total requirement wherever the fleet carries a significant
diesel share.
Per ASHRAE Handbook, HVAC Applications (2023), Chapter 16 and the International Mechanical Code: garages serving diesel vehicles require consideration of nitrogen dioxide alongside carbon monoxide, and the more demanding of the two balances governs the design airflow.
Demand Control Separates Installed Capacity From Annual Energy
The calculation sizes fans for a peak that occupies a small part of the year. The operating cost belongs to the hours in between, which is why sensor based control changes the economics without changing the equipment.
Two quantities that get confused:
Installed capacity is set by the design peak. That is what the
calculation returns.
Annual consumption is set by the number of operating hours and the
fraction of full flow in each of them. The calculation says nothing
about either.
The load profile of a garage:
Traffic concentrates in two short peaks of the working day and falls
close to zero overnight and at weekends. The fraction of hours spent
anywhere near the design condition is small.
What sensor based control delivers:
Staged or variable speed operation holds a low flow for most of the
time and reaches full flow only on a call from the detection system.
Fan power varies with the cube of flow, which makes the reduction
disproportionately valuable: running at half flow costs about an
eighth of the power.
A numerical illustration:
The example garage running continuously at 12,000 CFM (20,388 m³/h)
draws the power belonging to that flow around the clock. The same
system holding 30% of flow for twenty hours a day and full flow for
four consumes well under a third of the continuous case, because the
cubic relation prices those twenty hours at a few percent of full
power each.
Why codes require it:
Energy standards call for automatic control of garage ventilation for
exactly this reason, and continuous operation at full flow is not
accepted in current design without a justification.
Per ASHRAE Handbook, HVAC Applications (2023), Chapter 16 and energy standard provisions for garage ventilation: sensor based demand control reduces run hours and airflow between traffic peaks, and because fan power varies with the cube of flow, the saving is disproportionate to the reduction in airflow.
Worked Example: 120,000 Square Feet at 12,000 CFM
The scenario matches the Imperial example on the calculator page.
Floor area 120,000 ft² (11,148 m²)
Vehicle activity moderate
Incoming concentration 5 ppm
Target concentration 30 ppm
Step 1. Allowable rise.
Δppm = 30 − 5 = 25 ppm
Δppm_effective = max(25, 5) = 25 ppm
The floor is not reached.
Step 2. Activity multiplier.
Moderate activity: F = 1.00
Step 3. Target multiplier.
F_target = 25 / 25 = 1.00
Step 4. Required airflow.
Q = 120,000 × 0.10 × 1.00 × 1.00 = 12,000 CFM (20,388 m³/h)
Step 5. Category.
12,000 CFM falls in the band 10,000 to 39,999 → NORMAL
In Metric, 20,388 m³/h falls in 16,990 to 67,959 → NORMAL
The two unit systems agree, which they do because the category
thresholds are exact conversions of one another.
Step 6. Specific airflow and the code comparison.
12,000 / 120,000 = 0.10 CFM/ft² (1.83 m³/h·m²)
Against a continuous minimum near 0.05 CFM/ft²: twice as high.
Against a full prescriptive rate near 0.75 CFM/ft²: seven and a half
times lower.
The result describes holding a steady state concentration, not the
mode a detection system switches on.
Step 7. What the coefficient assumed.
Equivalent emission: 120,000 × 2.5 × 1.0 × 10⁻⁶ = 0.30 CFM of CO
(0.51 m³/h), which is about 594 g/h.
At forty vehicles in the peak hour that is roughly fifteen grams
each, consistent with a cold start and a slow manoeuvre to the exit.
Step 8. Time constant.
At a 10 ft (3.05 m) clear height the volume is 1,200,000 ft³
(33,980 m³).
τ = 1,200,000 / 12,000 = 100 minutes, giving 0.6 ACH.
A peak shorter than that will not bring the garage to the calculated
concentration.
Step 9. Sensitivity to the target.
A target of 20 ppm instead of 30 raises the airflow to 20,000 CFM
(33,980 m³/h).
A target of 15 ppm gives 30,000 CFM (50,970 m³/h).
Tightening the target by a third multiplies the airflow by 1.67.
Step 10. What to do with the result.
Use it as a basis for preliminary fan selection and as a plausibility
check on the prescriptive figure for this building.
Do not use it as evidence of code compliance or as an assurance that
no location in the garage exceeds the target.
Distribution, detector placement and the control sequence remain to
be checked separately.
Metric Example and the Activity Ladder
The scenario matches the Metric example on the calculator page.
Floor area 10,000 m² (107,639 ft²)
Vehicle activity heavy
Incoming 5 ppm, target 20 ppm

Δppm = 20 − 5 = 15 ppm
F = 1.50
F_target = 25 / 15 = 1.667
Q = 10,000 × 1.83 × 1.50 × 1.667 = 45,750 m³/h (26,928 CFM)
Category: 16,990 to 67,959 → NORMAL
Checking that the two unit systems agree:
The same case in Imperial units:
107,639 × 0.10 × 1.50 × 1.667 = 26,910 CFM
against the 26,928 CFM obtained by converting the Metric result.
The 0.07% difference comes from the coefficient being published as
1.83 rather than the exact 1.829, and it confirms that the constants
of the two systems are consistent.
The activity ladder on one building:
At 10,000 m² (107,639 ft²) with a 15 ppm rise:
  Light 0.70:       21,350 m³/h (12,566 CFM)
  Moderate 1.00:    30,500 m³/h (17,952 CFM)
  Heavy 1.50:       45,750 m³/h (26,928 CFM)
  Very Heavy 2.20:  67,100 m³/h (39,494 CFM)
What the ladder shows:
The span between the extreme steps is 2.20 / 0.70 = 3.14. The
activity multiplier is the most influential input after floor area,
and it is also the most loosely defined: four verbal steps with no
numerical criterion for assigning a building to one of them.
How the step is chosen:
The guide is the turnover of a parking space during the peak hour
rather than the average daily occupancy.
A residential garage with a morning departure and an evening return
spends most of the day in the light regime and is designed on the
peak one.
A shopping centre at the weekend runs in the heavy regime for many
consecutive hours.
Why both adjacent steps are worth calculating:
The boundary between steps has no numerical definition and adjacent
steps differ by 43 to 50%. Running the calculation on both produces a
bracket, and the defensible answer sits inside it.
Per the calculator's activity factors: the ladder spans a factor of 3.14 between light and very heavy use, making it the most influential input after floor area, and the boundaries between steps are qualitative rather than numerical.
Application Boundaries: Transients, Modelling, Code Acceptance
The model is a preliminary estimate of the airflow required to dilute carbon monoxide under complete mixing at steady state. Everything below sits outside that scope and needs its own treatment.
Transient conditions. The model is steady state while the load arrives in waves, and the time constant of a garage runs to tens of minutes at screening airflows.
Air distribution. Complete mixing is assumed and no distribution effectiveness term exists in the model. Dead-end bays and stagnant pockets need airflow modelling or measurement at commissioning.
Other contaminants. Only CO is considered. With a diesel fleet NO₂ can govern, and with heavy traffic particulate matter enters the picture as well.
Geometry. Ceiling height, ramp gradient and configuration, the number of levels and the position of openings all act on distribution and appear nowhere in the calculation.
Fleet composition and driving pattern. The proportion of cold starts, the age of the fleet and the idling time at a barrier are all replaced by one activity multiplier.
Detector placement and control logic. These determine the concentration the system actually holds, and both lie outside the calculation.
Smoke control. Emergency ventilation during a fire is designed separately and against different requirements.
Code acceptance. The performance route requires the assumptions to be defended before the authority having jurisdiction, and the prescriptive figures that apply depend on the edition and the jurisdiction.
System aerodynamics. Pressure loss, fan selection, the choice between an impulse and a ducted extract arrangement, and the supply air paths are all outside the model.
Per ASHRAE Handbook, HVAC Applications (2023), Chapter 16 and the International Mechanical Code: steady state dilution of carbon monoxide under a complete mixing assumption is the scope of this model, while transient response, air distribution, other contaminants, detection strategy, smoke control, and code acceptance require separate treatment.
Parking Garage CO Ventilation Calculator
Parking garage CO ventilation by a dilution balance: it multiplies the floor area by a fixed emission coefficient, scales it for vehicle activity, and scales it again by the ratio of a reference concentration rise to the one the project allows, returning a screening airflow. Rearranged, it is the assumed emission rate divided by the allowable rise, which is what makes the coefficient checkable against traffic data. The result is a steady state peak basis under complete mixing, not a code compliance figure and not an average operating airflow.
Open Parking Garage CO Ventilation CalculatorStandards and References
- ASHRAE Handbook, HVAC Applications (2023), Chapter 16, Enclosed Vehicular Facilities. Ventilation design for enclosed parking structures, contaminant emission assumptions, demand controlled operation, and detector placement.
- ANSI/ASHRAE Standard 62.1 (2022), Ventilation for Acceptable Indoor Air Quality. Ventilation requirements for enclosed parking garages and the associated vehicle service spaces.
- International Mechanical Code, garage ventilation provisions. Prescriptive rates per unit of floor area, the conditions for intermittent operation, and the requirements placed on contaminant detection and control. The applicable edition is set by the jurisdiction.
- NFPA 88A, Standard for Parking Structures. Requirements for enclosed and open parking structures, including the ventilation-related provisions.
- ASHRAE TC 5.9, Enclosed Vehicular Facilities. The technical committee maintaining design methods for parking structures and transport facilities.
- ASHRAE Research Project 945-RP. Field measurement of parking garage ventilation and comparison of measured contaminant levels against design assumptions.
- NIOSH Pocket Guide to Chemical Hazards (2007, with subsequent updates). Exposure limits for carbon monoxide, including the time-weighted average and the ceiling value.
- ACGIH Threshold Limit Values and Biological Exposure Indices (revised annually). Occupational exposure values for carbon monoxide and nitrogen dioxide.
- Manufacturer data for impulse ventilation systems and CO detectors. Jet throw and coverage area, detector accuracy, drift and calibration interval.
FAQ
How is parking garage CO ventilation calculated?
Per ASHRAE Handbook, HVAC Applications (2023), Chapter 16: as a dilution balance, in which the required airflow is the assumed emission rate divided by the allowable concentration rise between incoming and indoor air. The screening model expresses the emission as a coefficient per unit of floor area scaled by a vehicle activity factor.
Why does halving the allowable CO rise double the airflow?
Per the dilution relation: the allowable rise sits in the denominator, so airflow varies inversely with it. Tightening an indoor target from 30 to 20 ppm against a 5 ppm incoming level takes the allowable rise from 25 to 15 ppm and multiplies the requirement by 1.67, and reaching 10 ppm multiplies it by five.
What CO concentration should the design target?
Per NIOSH and ACGIH exposure guidance: a value below the applicable time-weighted average limit, with margin for fluctuation. Published average limits sit in the range of 25 to 50 ppm depending on the organisation, with separate lower ceilings for short excursions, and the applicable values depend on the jurisdiction.
How does the screening result compare with prescriptive code airflow?
Per the International Mechanical Code garage provisions: the prescriptive route sets a rate per unit of floor area, with a continuous minimum and a higher full rate triggered by the detection system. The screening model at moderate activity and a 25 ppm allowable rise returns 0.10 CFM/ft² (1.83 m³/h·m²), which sits between those two figures and describes a different regime from the triggered full rate.
Why does the model impose a 5 ppm minimum on the allowable rise?
Per the calculator's stated basis: to keep the arithmetic finite, since a vanishing allowable rise sends the required airflow towards infinity. Reaching that floor is a signal that the incoming air is too close to the target for outdoor air dilution to be a viable strategy, and it usually means the background assumption should be rechecked.
Does the calculated airflow guarantee safe conditions everywhere?
Per ASHRAE Chapter 16: no. The balance assumes complete mixing, while a real garage holds pockets the air never reaches, and total airflow does not by itself deliver dilution to them. Detector placement then decides which concentration the control system actually defends.
Is carbon monoxide always the governing contaminant?
Per ASHRAE Chapter 16 and code provisions for diesel vehicles: no. Diesel engines emit substantially less carbon monoxide and considerably more nitrogen dioxide, whose exposure limits are numerically much lower, so in garages serving diesel fleets the nitrogen dioxide balance can demand more airflow than the carbon monoxide one.
Related Calculators
- Vehicle Exhaust Extraction: Capture of exhaust at the tailpipe rather than dilution of it afterwards, which is the approach that applies to repair bays and service positions where a vehicle runs in one place.
- Indoor Air Quality CO2 Calculator: The same dilution balance for a different contaminant and a different source, where the limit comes from the perception of freshness rather than from toxicology.
- Tunnel Ventilation Rate: The adjacent case of ventilating against a vehicle contaminant, with the piston effect of moving traffic added to the dilution.
- Mine Ventilation Airflow: Contaminant dilution underground, where the sources are the equipment and the rock itself.
- Ventilation Rate Calculator: Outdoor air rates to ASHRAE 62.1 for ordinary occupied spaces, the comparison that shows how differently a garage is treated.
- Air Changes Per Hour Calculator: The relation between airflow and volume that fixes the time constant governing how a garage responds to a peak.
- Fan Power Calculator: Fan power, which climbs with the cube of flow and is what makes demand control worth its controls.
- Duct Pressure Drop Calculator: Pressure loss through a garage extract network, which decides what the selected fans have to deliver.