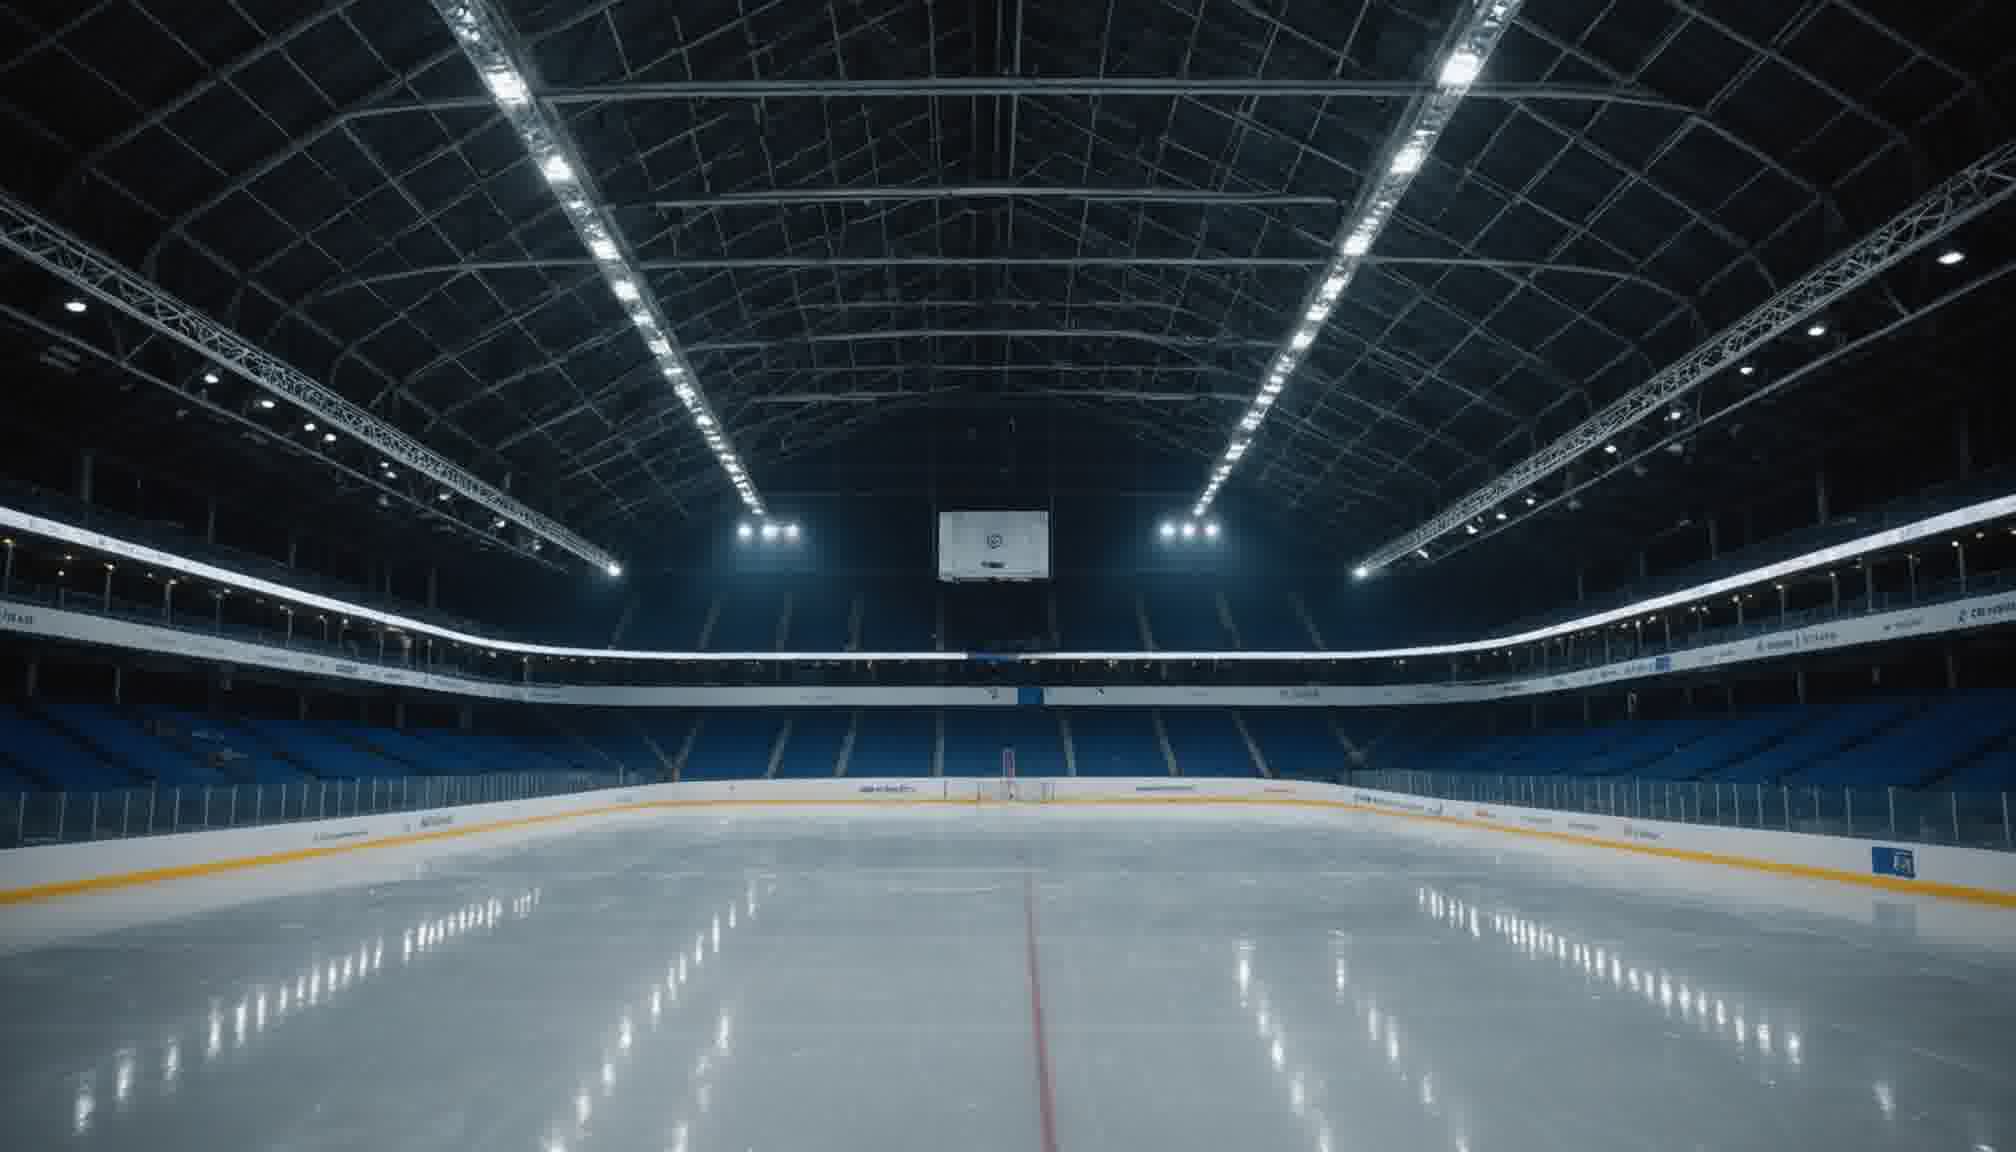
Why an Ice Rink Is a Radiant Problem Rather Than an Air Problem
Most refrigerated spaces are cooled against the air around them. An ice rink is not one of them. It is a horizontal cold surface lying under a large warm ceiling, and the dominant path by which heat reaches that surface is radiation across the gap rather than convection from the air above it.
The geometry is what makes it so. The ice sits at roughly 24°F (−4°C) while the ceiling above it sits near 60°F (16°C), and the two surfaces face each other almost completely, with a view factor near unity. Radiant exchange between two large parallel surfaces depends on the fourth power of absolute temperature and on the emissivities of both, and for a painted or bare structural ceiling the resulting flux typically exceeds every other term in the load.
The design levers that follow are not the ones a cold storage engineer would reach for first. Insulating the walls of a rink barely moves the number, because the walls are not where the heat arrives. Lowering the air temperature helps only the convective share, which is a fraction of the whole. What moves the load is what the ice can see, which is why ceiling emissivity turns out to be the highest return measure available on most existing rinks.
The calculator takes a total refrigeration load and a rink area and returns the load per unit area, classified against fixed severity bands. It normalizes rather than computes, which makes it a screening and comparison tool: it answers whether a load is heavy for the surface it serves, not where that load came from. This article supplies the second half, the composition behind the number, because a load intensity of 58 BTU/h·ft² means one thing with a painted ceiling and something else entirely with a low-emissivity one. The cold storage door article took the same approach on a single component of a refrigeration load. This one takes the whole.
Calculator Inputs: A Load You Must Already Have, and an Area
Two fields and a unit toggle, which is unusually few, and the shortness of the list is itself the point.
Unit System. Imperial (BTU/h, ft²) or Metric (kW, m²), switched at the top of the page.
Total Refrigeration Load [BTU/h or kW]. The full refrigeration demand for the operating case under consideration. This value arrives from a component-level calculation performed elsewhere, not from this page.
Rink Area [ft² or m²]. The active cooled area of the ice sheet. An NHL sheet is 200 × 85 ft (61 × 26 m), which is 17,000 ft² (1,586 m²). An Olympic sheet is 200 × 100 ft (61 × 30 m), which is 20,000 ft² (1,858 m²). Practice sheets and curling surfaces run considerably smaller.
Output is Load Intensity in BTU/h·ft² or W/m², with a band classification attached to it.
What that field list means in practice:
The calculator normalizes, it does not compute.
The total load has to be produced separately, component by component.
An error in the entered load passes into the result unchanged.
Which operating case to enter:
The design case is the heaviest one the facility runs:
summer outdoor peak, full seating, full lighting,
resurfacing frequency set by a competition schedule.
An off-season or overnight case gives roughly half the intensity
and is not a basis for equipment selection.
What the calculator does not do: the component breakdown, any check of plant capacity, any handling of schedule, any estimate of the resurfacing transient, any account of hall humidity and dehumidification, and any treatment of ice condition.
Normalizing by Area and Why Intensity Beats a Total
A total refrigeration load carries no information about severity until it is set against the surface it serves, which is why the comparable quantity between facilities is load per unit area.
Imperial: Load Intensity = Refrigeration Load [BTU/h] / Rink Area [ft²]
Metric:   Load Intensity = Refrigeration Load [kW] × 1000 / Rink Area [m²]
The reason a total misleads is easiest to see with one figure placed on two sheets:
420,000 BTU/h on a 7,200 ft² sheet gives 58.3 BTU/h·ft², an ordinary case.
The same 420,000 BTU/h on a standard 17,000 ft² sheet gives 24.7 BTU/h·ft²,
which sits below the lowest threshold and means either a very light
operating case or understated input assumptions.
One number describes two situations that have nothing in common.
What normalization buys:
Arenas of different size compared on one scale.
A load that grew after a refurbishment attributed to the operating case
rather than to the extra area.
Somebody else's calculation checked with a single division.
What it does not buy:
Intensity says nothing about where the load came from.
Two rinks at 58 BTU/h·ft² can have entirely different compositions:
the ceiling dominates at one, ventilation and resurfacing at the other.
The measures that reduce them are not the same measures.
One point on the divisor. The area to enter is the active cooled ice surface, not the floor area of the hall and not the area inside the dasher boards. Those three differ by enough to move a result across a band edge, and a review of somebody else's intensity figure is worth starting with the question of which of them they divided by.
Per ASHRAE Handbook, Refrigeration (2022), Chapter 44: refrigeration demand for ice rinks is compared as load per unit of ice surface, because total load alone does not indicate severity.
The Severity Bands and What Sits Inside Them
The calculator classifies the result against five bands, fixed in each unit system.
| Imperial, BTU/h·ft² | Metric, W/m² | Classification |
|---|---|---|
| Below 35 | Below 110 | TOO LOW |
| 35 to below 50 | 110 to below 160 | LOW / MARGINAL |
| 50 to 75 | 160 to 240 | RECOMMENDED |
| Above 75 to 95 | Above 240 to 300 | HIGH |
| Above 95 | Above 300 | TOO HIGH |
What sits behind each of them:
TOO LOW: either a genuinely light case (a closed arena in winter, lights off,
  no spectators) or, more often, understated assumptions.
  Check the composition rather than celebrating the number.
LOW / MARGINAL: an economical case or a mild climate. There is margin,
  though it may not survive the summer peak.
RECOMMENDED: the ordinary working range of an indoor arena on a normal
  schedule with an ordinary ceiling.
HIGH: a heavy case. High occupancy, intensive resurfacing, a hot humid
  climate, or a ceiling with high emissivity.
TOO HIGH: almost always a signal about construction or operation rather than
  climate: an untreated ceiling, insufficient dehumidification,
  excessive ventilation.
How to read a low result:
The lower bands do not mean efficiency.
An understated input load earns the same label as an honestly light case,
and the consequences are opposite: in the second the plant is correctly
selected, in the first it will be undersized at the summer peak.
The bands are expert ranges, not code:
These are ranges of engineering practice rather than the requirement
of any standard. A design case can legitimately sit outside a band.
Per ASHRAE Chapter 44 and industry practice: ice rink load intensity commonly falls between 50 and 75 BTU/h·ft² (160 to 240 W/m²) for conventional indoor facilities, with values above and below that range signalling either unusual operating conditions or questionable load assumptions.
The Two Band Sets Do Not Convert Exactly
The Imperial and metric band edges are not exact equivalents of one another, and near two of the four thresholds the same rink changes classification when the unit toggle is switched.
The exact factor:
1 BTU/h·ft² = 0.293071 W / 0.092903 m² = 3.15459 W/m²
The thresholds converted:
35 BTU/h·ft² × 3.15459 = 110.4   page shows 110   deviation 0.4%
50 × 3.15459 = 157.7             page shows 160   deviation 1.4%
75 × 3.15459 = 236.6             page shows 240   deviation 1.4%
95 × 3.15459 = 299.7             page shows 300   deviation 0.1%
The outer thresholds were converted closely, the middle two rounded up to round figures, which leaves two zones where the two systems disagree:
157.7 to 160.0 W/m² (50.0 to 50.7 BTU/h·ft²):
  Imperial returns RECOMMENDED, Metric returns LOW / MARGINAL
236.6 to 240.0 W/m² (75.0 to 76.1 BTU/h·ft²):
  Imperial returns HIGH, Metric returns RECOMMENDED
How much weight that deserves:
Each zone is about 1.4% wide, which is well inside the accuracy
with which the load itself is known.
The bands are expert ranges, so rounding to round numbers in the metric
system is a defensible choice made for readability.
The practical conclusion is single: a result near a band edge should not
be read as a label. Hold one unit system for the whole project, and at a
borderline value look at the composition rather than at the colour
of the badge.
Per unit conversion: one BTU per hour per square foot equals 3.15459 watts per square metre, so band edges rounded to convenient figures in one system do not land exactly on their counterparts in the other.
Where the Load Comes From: The Component Breakdown
The calculator asks for a total that has to come from somewhere, and the composition of that total for an ice rink is unlike any other refrigerated space, because roughly half of it arrives as radiation onto a horizontal surface.
A conventional indoor arena with an ordinary ceiling splits roughly as follows:
Radiation from ceiling and structure:   35 to 50%
Convection from the hall air:           10 to 20%
Resurfacing the ice sheet:              10 to 15%
Lighting (radiant share onto the ice):   5 to 15%
Spectators and skaters:                  5 to 10%
Floor gain and subfloor heating:          3 to 8%
Pumps, piping, headers:                   2 to 5%
Why the split leans so far toward radiation:
The ice is a large horizontal surface facing upward, and its view factor
to the ceiling is close to unity. Nearly everything the ice can see
is ceiling.
What that changes about priorities:
Wall insulation, which would be the first step on a cold storage building,
returns little here, because the walls are not in the field of view of the ice.
Lowering the air temperature acts only on the convective share.
Changing what the ice sees acts on the largest component there is.
Humidity works as an amplifier on top of that. Moist hall air raises both the convective and the radiant terms, since water vapour participates in infrared exchange, and condensation onto the ice adds a latent load while spoiling the surface. Dehumidification of the hall therefore reduces the refrigeration load as a side effect of its own primary job.
Per ASHRAE Handbook, Refrigeration (2022), Chapter 44: radiant gain to the ice surface is the largest single component of ice rink refrigeration load in conventional facilities, followed by convection, resurfacing, and lighting.
Ceiling Radiation: The Largest Single Term
The radiant term follows the fourth-power law between two large facing surfaces, and running the numbers for an ordinary rink shows why it dominates everything else on the list.
q = ε_eff × σ × (T_ceiling⁴ − T_ice⁴)

σ     = 0.1714 × 10⁻⁸ BTU/(h·ft²·R⁴)   [5.67 × 10⁻⁸ W/(m²·K⁴)]
T     = absolute temperature [R or K], 480 to 540 R (267 to 300 K)
ε_eff = 1/(1/ε_ceiling + 1/ε_ice − 1)  for two large parallel surfaces
ε_ceiling typical range: 0.05 (low-e foil) to 0.95 (painted or bare structure)
ε_ice     ≈ 0.95, effectively fixed
For an ordinary arena:
Ceiling 60°F (519.67 R), ice 24°F (483.67 R)
Painted ceiling ε 0.90, ice ε 0.95

ε_eff = 1/(1/0.90 + 1/0.95 − 1) = 1/1.1637 = 0.859
T_ceiling⁴ = 519.67⁴ = 7.293 × 10¹⁰
T_ice⁴     = 483.67⁴ = 5.473 × 10¹⁰
difference  = 1.820 × 10¹⁰

q = 0.859 × 0.1714e-8 × 1.820e10 = 26.8 BTU/h·ft² (84.6 W/m²)
Set against the total load of the worked example:
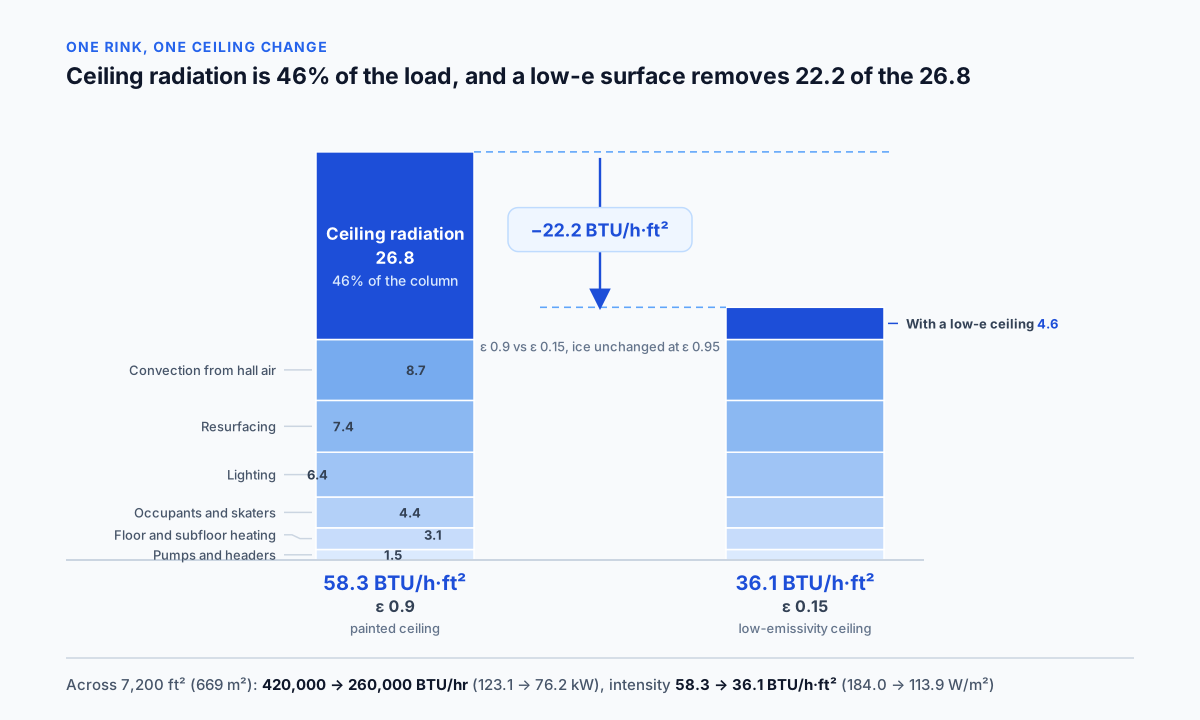
At an intensity of 58.3 BTU/h·ft², the ceiling alone supplies 26.8,
which is 46% of everything.
Across 7,200 ft² that is 193,000 BTU/h (56.6 kW) out of 420,000 BTU/h.
The fourth power is what makes the ceiling temperature worth watching:
Gain does not rise linearly with the temperature difference.
Raising the ceiling from 60 to 70°F (16 to 21°C) lifts the radiant gain
from 26.8 to 35.3 BTU/h·ft² (84.6 to 111.4 W/m²), a rise of 32%,
while the temperature difference itself rises 28%, from 36 to 46°F.
The practical consequence: an overheated dome above the seating
costs more than the temperature difference suggests.
And the emissivity structure decides which surface is worth treating:
ε_eff is set almost entirely by whichever surface radiates worse.
Ice sits at ε ≈ 0.95 and cannot be changed.
The ceiling can be, which leaves it as the only controllable variable
in the equation.
Per ASHRAE Handbook, Fundamentals (2025), Chapter 4: radiant exchange between two large parallel surfaces follows the fourth-power law with an effective emissivity given by 1/(1/ε₁ + 1/ε₂ − 1), dominated by whichever surface radiates worse.
Low-Emissivity Ceilings and the Retrofit That Outperforms Insulation
Because effective emissivity is set by the worse of the two surfaces and the ice cannot be changed, covering the ceiling with a low-emissivity material is the single measure that acts directly on the largest component of the load.
The same case with the ceiling treated:
Low-emissivity ceiling ε 0.15, ice ε 0.95
ε_eff = 1/(1/0.15 + 1/0.95 − 1) = 1/6.719 = 0.149

q = 0.149 × 0.1714e-8 × 1.820e10 = 4.6 BTU/h·ft² (14.6 W/m²)
What that removes:
26.8 − 4.6 = 22.2 BTU/h·ft² (70.0 W/m²)
Across 7,200 ft²: 160,000 BTU/h (46.9 kW)
Total load falls from 420,000 to 260,000 BTU/h,
and intensity from 58.3 to 36.1 BTU/h·ft²
Why it beats insulation by an order of magnitude:
Insulation acts on envelope transmission, which is a few percent
of the load on an arena.
A low-emissivity ceiling acts on the component supplying about half of it.
The return differs by an order of magnitude at comparable or lower cost.
Two further effects come with it:
Cutting the radiant gain raises the temperature of the underside of the
ceiling, which reduces the risk of condensation and of drips onto the ice.
Cutting the load raises the brine temperature at the same ice temperature,
which improves the coefficient of performance of the plant.
The qualifications are worth stating plainly:
The claimed emissivity applies to a clean surface.
Dust, condensate, and ageing raise it over time.
The material has to hold its properties in a humid hall.
The calculation above assumes the full field of view of the ice is covered;
partial coverage returns a proportionally smaller effect.
Per ASHRAE Chapter 44 and low-emissivity ceiling manufacturer data: covering a rink ceiling with a low-emissivity surface reduces the radiant component several-fold and is commonly the highest-return measure available on an existing facility.
Resurfacing: A Transient the Hourly Average Hides
Resurfacing delivers a large quantity of hot water onto the ice several times a day, and although the calculation absorbs it as an average hourly figure, the plant experiences it as a series of peaks.
The energy in one flood:
100 gallons (379 L) of water, 833 lb (378 kg), at 140°F (60°C)

Cooling to 32°F (0°C):   833 × 1.0 × 108 = 89,960 BTU
Freezing:                833 × 144       = 119,950 BTU
Cooling the ice to 24°F: 833 × 0.5 × 8   =   3,330 BTU
Total per flood:                           213,000 BTU (225 MJ)
Averaged over the day:
6 floods per day: 1,279,000 BTU/day / 24 = 53,300 BTU/h (15.6 kW)
Across 7,200 ft²: 7.4 BTU/h·ft², which is 12.7% of the example intensity
The dominance of the phase change decides which lever works:
Of the 213,000 BTU per flood, 120,000, or 56%, is the phase change
rather than the cooling of the water.
Dropping the flood water from 140 to 120°F (60 to 49°C) removes
16,700 BTU per flood, about 8% of the figure, because the bulk of it
does not depend on temperature at all.
The transient side of it:
A flood delivers its energy over a few minutes, not over an hour.
The compressor sees a peak that the average does not represent.
On a dense competition schedule the interval between floods may not let the
system return to steady state, and the ice temperature drifts upward
through the day.
What actually reduces the term:
Cutting the water volume per flood acts linearly and does the most.
Cutting the water temperature acts weakly, for the reason above.
Cutting the number of floods runs into ice quality requirements.
Per ASHRAE Handbook, Refrigeration (2022), Chapter 44: resurfacing typically contributes 10 to 15% of ice rink refrigeration load, of which the latent heat of fusion is the larger part, so water volume matters more than water temperature.
Ice Thickness Raises the Brine Temperature the Plant Must Deliver
The ice sheet is a layer of thermal resistance between the surface being cooled and the pipes doing the cooling, so thicker ice forces the brine colder for the same surface temperature, and colder brine costs compressor efficiency.
The resistance of the layer:
Thermal conductivity of ice k ≈ 1.3 BTU/(h·ft·°F)  [2.25 W/(m·K)]
R = thickness / k
Working thickness range: 1.0 to 1.5 in (25 to 38 mm)

At 1.25 in (32 mm): R = (1.25/12)/1.3 = 0.080 h·ft²·°F/BTU
The drop across that thickness:
At an intensity of 58.3 BTU/h·ft²: ΔT = 58.3 × 0.080 = 4.7°F (2.6°C)
The brine has to sit 4.7°F below the required surface temperature
What one extra inch costs:
Growing from 1.0 to 2.0 in (25 to 51 mm) adds
R = (1.0/12)/1.3 = 0.064 h·ft²·°F/BTU
ΔT grows by 58.3 × 0.064 = 3.7°F (2.1°C)
The brine has to be held 3.7°F colder for the same surface
Priced in energy:
Coefficient of performance falls roughly 2 to 3% per degree Fahrenheit
of suction temperature reduction.
The extra 3.7°F therefore costs 8 to 11% of compressor input, paid
for ice that nobody needs thicker than it has to be.
The operational side is straightforward. Ice builds up from repeated flooding and needs periodic shaving. Shaving reduces both the thickness and the mass that has to be cooled, and both effects work in favour of the plant.
Per ASHRAE Chapter 44: ice thickness adds thermal resistance between the surface and the slab piping, so each additional inch requires colder brine for the same surface temperature and costs compressor efficiency accordingly.
Subfloor Heating Is a Load Added on Purpose
Under a permanently refrigerated slab the ground itself freezes, and freezing ground heaves, so rinks deliberately heat the soil beneath the slab, adding a load the refrigeration plant then has to remove.
The mechanism:
A continuously cooled slab freezes the ground beneath it.
Water in that ground expands as it freezes, lifting the slab unevenly.
The result is a cracked slab and a rink surface out of level.
The measure:
A heating circuit is laid below the slab insulation, holding the ground
above freezing point.
Typical output 1 to 2.5 BTU/h·ft² (3 to 8 W/m²).
The paradox worth understanding:
The heat is added on purpose, passes upward through the insulation,
and lands in the refrigeration load.
Slab insulation works in both directions: it reduces the gain from the
heating circuit and the loss of cooling into the ground.
The magnitude:
On the example arena, 1.5 BTU/h·ft² is 2.6% of the intensity,
which is 10,800 BTU/h (3.2 kW) out of 420,000.
Small next to the ceiling, but continuous and around the clock.
Seasonal facilities are the exception. Where the ice is removed for the summer the ground thaws, and the subfloor circuit can be switched off or reduced. Year-round arenas hold it permanently.
Per ASHRAE Chapter 44: subfloor heating is provided beneath permanently refrigerated slabs to prevent frost heave, typically at 1 to 2.5 BTU/h·ft² (3 to 8 W/m²), and that heat becomes part of the refrigeration load.
Worked Example: 420,000 BTU per Hour Across 7,200 Square Feet
The case matches Example 1 on the calculator page.
Total refrigeration load 420,000 BTU/h (123.1 kW, 35.0 tons of refrigeration)
Ice sheet area 7,200 ft² (669 m²)
Step 1. Normalize.
Load Intensity = 420,000 / 7,200 = 58.33 BTU/h·ft² (184.0 W/m²)
Step 2. Classify.
58.33 sits inside the 50 to 75 band → RECOMMENDED
In metric, 184.0 sits inside 160 to 240 → RECOMMENDED
Both systems agree, and the value is far from either edge
Step 3. What stands behind the number with an ordinary ceiling.
Radiation from the ceiling    26.8 BTU/h·ft²   46%
Convection from the air        8.7             15%
Resurfacing                    7.4             13%
Lighting                       6.4             11%
Spectators and skaters         4.4              8%
Floor and subfloor heating     3.1              5%
Pumps and headers              1.5              3%
Total                         58.3            100%
Step 4. Check the radiant share.
q = 0.859 × 0.1714e-8 × (519.67⁴ − 483.67⁴) = 26.8 BTU/h·ft²
Across 7,200 ft²: 193,000 BTU/h (56.6 kW) out of 420,000
Step 5. Apply a low-emissivity ceiling.
q falls to 4.6 BTU/h·ft², removing 22.2
Total load: 420,000 − 160,000 = 260,000 BTU/h (76.2 kW)
New intensity: 260,000 / 7,200 = 36.1 BTU/h·ft² (113.9 W/m²)
Step 6. Read the new classification carefully.
36.1 lands in LOW / MARGINAL rather than in RECOMMENDED.
This is the case where a low result does mean an efficient building
rather than understated assumptions.
The band label describes the load, not the quality of the design,
which is exactly why the bands should not be read as a score.
Step 7. What it does to the plant.
Falling from 35.0 to 21.7 tons of refrigeration changes the compressor
frame size and, more usefully on an existing arena, restores capacity
margin where there was none.
Step 8. What is left to work on.
After the ceiling, the largest remaining terms are convection and resurfacing.
Convection responds to dehumidification and to hall temperature,
resurfacing to flood volume.
Both return single-digit percentages against the ceiling's forty-six.
Step 9. Measures ranked by return.
Low-emissivity ceiling:              −22.2 BTU/h·ft²
Dehumidification and hall air setup:  −2 to −4
Flood volume cut by a third:          −2.5
Shaving ice to working thickness:     indirectly, through brine temperature
Wall insulation:                      fractions of a unit
Step 10. Result.
58.33 BTU/h·ft² (184.0 W/m²), RECOMMENDED, a typical indoor arena with an
ordinary ceiling. Of that figure 46% rests on one controllable property,
and acting on it moves the facility into the band below.
Metric and Too-High Worked Examples
The metric case matches Example 2 on the calculator page.
Total load 150 kW (512,000 BTU/h), area 670 m² (7,212 ft²)

Load Intensity = 150 × 1,000 / 670 = 223.88 W/m² (70.97 BTU/h·ft²)
223.88 sits inside the 160 to 240 band → RECOMMENDED
Cross-checking the two systems:
70.97 BTU/h·ft² also lands inside 50 to 75 → RECOMMENDED
The value stands far enough from the upper edge that the threshold
rounding described earlier does not reach it
Against the first example:
The area is practically identical (670 m² against 669 m²), yet the intensity
is 22% higher: 223.9 against 184.0 W/m².
The difference is a heavier operating case: higher occupancy, a denser
resurfacing schedule, or a ceiling of higher emissivity.
The TOO HIGH case matches Example 3 on the page.
Total load 800,000 BTU/h (234.5 kW), area 7,200 ft² (669 m²)

Load Intensity = 800,000 / 7,200 = 111.11 BTU/h·ft² (350.5 W/m²)
111.11 is above the 95 threshold → TOO HIGH
350.5 is above the 300 threshold → TOO HIGH, both systems agree
What a figure like that means:
Nearly double the first example on the same area. Climate alone does not
produce it: the temperature difference enters the radiant term to the fourth
power, but a ceiling is rarely that much hotter.
The causes are usually built in: an untreated metal ceiling of high
emissivity, insufficient dehumidification, excessive outdoor air supply,
or several of them together.
Diagnosis by composition:
At 111 BTU/h·ft² the ceiling is checked first, because it is the only
component capable of a difference on that scale. If the ceiling is already
low-emissivity, ventilation and hall humidity come next, where an excess of
outdoor air adds both sensible and latent load.
Per ASHRAE Chapter 44: intensities above 95 BTU/h·ft² (300 W/m²) usually indicate a construction or operating problem rather than an unusual climate, because the components capable of a difference of that magnitude are ceiling emissivity, dehumidification, and ventilation rate.
Application Boundaries: Component Analysis, Transients, Plant Verification
The scope is narrow and worth stating: normalizing a load that is already known against the ice area, and placing the result in an expert band. Nine cases need separate treatment.
Component calculation. The calculator neither computes the load nor tests its composition. The figure arrives from outside, and an error in it passes straight through.
The resurfacing transient. Flooding enters as an average hourly value, while the plant sees a peak lasting minutes. Compressor selection on a dense schedule requires the peaks to be examined.
Dehumidification and hall humidity. Humidity affects the convective term, the latent term, and ice quality, and none of it appears in the model.
Plant verification. Intensity says nothing about installed capacity, compressor selection, or evaporating temperature.
Schedule. One value describes one operating case. Annual consumption requires a profile across cases rather than a design peak.
Ice properties and surface. Thickness, surface temperature, and ice quality requirements change the brine temperature the plant must deliver, none of which enters the intensity.
Hall geometry. The view factor between ice and ceiling is taken as close to unity, which holds for an ordinary hall but not for arenas with a high dome, large glazing, or seating that partly blocks the field of view.
Outdoor climate. Seasonal swing and the summer peak move the ventilation and envelope terms, so the design case should be taken at the worst operating condition.
Bands as a score. The bands describe how heavy a load is, not how good a design is, and a low result can mean an efficient building or understated assumptions. The worked example makes the point: the same rink reads RECOMMENDED before the ceiling is treated and LOW / MARGINAL after, having become better rather than worse.
Per ASHRAE Handbook, Refrigeration (2022), Chapter 44: load intensity normalization is a screening step, while component-level heat gain analysis, transient behaviour, dehumidification, and plant capacity verification require separate treatment.
Ice Rink Refrigeration Load Calculator
Ice rink refrigeration load intensity by area normalization: divides the total refrigeration load by the active ice surface area and classifies the result against fixed severity bands, in BTU per hour per square foot or watts per square metre. It normalizes rather than computes, so the total load has to come from a component-level analysis first, and the composition behind the number matters as much as the number itself. In conventional rinks the largest single component is radiation from the ceiling onto the ice. A screening and comparison tool per ASHRAE Refrigeration, not a plant design.
Open Ice Rink Refrigeration Load CalculatorStandards and References
- ASHRAE Handbook, Refrigeration (2022), Chapter 44, Ice Rinks. Refrigeration load composition, radiant gain onto the ice, resurfacing, subfloor heating, ice thickness, and typical load intensities.
- ASHRAE Handbook, Fundamentals (2025), Chapter 4, Heat Transfer. Radiant exchange between surfaces, effective emissivity of two large parallel surfaces, and the Stefan-Boltzmann constant in both unit systems.
- ASHRAE Handbook, HVAC Applications (2023), chapters covering sports and recreational facilities. Ice rink design, hall dehumidification, and ceiling systems.
- IIHF Ice Rink Guide (2016). Sheet dimensions, ice quality requirements, and operating practice for competition and community facilities.
- IIAR, Ammonia Refrigeration Piping Handbook and application bulletins (2021). Practice for ammonia plants serving ice rinks, including secondary brine circuits.
- ASHRAE Standard 15-2022, Safety Standard for Refrigeration Systems. Machinery room requirements for the refrigeration plant serving the sheet.
- ASHRAE Standard 90.1-2022, Energy Standard for Buildings Except Low-Rise Residential Buildings. Energy efficiency requirements applicable to facility refrigeration equipment.
- Manufacturer data for low-emissivity ceiling systems (2020 onward). Claimed emissivity, the cleanliness and coverage conditions under which it is achieved, and verified load reductions.
- Literature on subfloor heating and frost heave prevention beneath permanently refrigerated slabs, including ASHRAE Handbook, Refrigeration (2022) guidance on slab construction and insulation.
FAQ
What is a normal refrigeration load intensity for an ice rink?
Per ASHRAE Handbook, Refrigeration (2022), Chapter 44: conventional indoor rinks fall between 50 and 75 BTU/h·ft² (160 to 240 W/m²). Below 35 BTU/h·ft² (110 W/m²) either the operating case is very light or the load assumptions are understated, and above 95 BTU/h·ft² (300 W/m²) the cause is usually construction or operation rather than climate.
What is the largest single heat gain in an ice rink?
Per ASHRAE Chapter 44: radiation from the ceiling onto the ice, typically 35 to 50% of the total. The ice is a large horizontal surface with a view factor near unity to the ceiling, and radiant exchange follows the fourth power of absolute temperature, so the ceiling dominates over the air.
How much does a low-emissivity ceiling save?
Per the radiant relation and manufacturer data: a great deal. Dropping ceiling emissivity from 0.90 to 0.15 takes the effective emissivity from 0.859 to 0.149 and the radiant flux from 26.8 to 4.6 BTU/h·ft² (84.6 to 14.6 W/m²). On a 7,200 ft² (669 m²) sheet that is 160,000 BTU/h (46.9 kW), around 38% of a typical total load.
Why does the calculator not compute the load itself?
Per its stated scope: it normalizes rather than computes. The total load comes from a component-level analysis covering radiation, convection, resurfacing, lighting, occupancy, envelope, and subfloor heating, and this calculator turns that total into a comparable intensity.
How much load does resurfacing add?
Per ASHRAE Chapter 44: typically 10 to 15%. One flood of 100 gallons (379 L) at 140°F (60°C) carries about 213,000 BTU (225 MJ), of which 56% is the latent heat of fusion, so reducing water volume helps considerably more than reducing water temperature.
Does thicker ice cost energy?
Per ASHRAE Chapter 44: yes. Ice is thermal resistance between the surface and the slab piping. Going from 1 to 2 inches (25 to 51 mm) raises the required brine-to-surface difference by about 3.7°F (2.1°C), which costs roughly 8 to 11% of compressor input at 2 to 3% per degree Fahrenheit.
Why is heat added under a rink slab on purpose?
Per ASHRAE Chapter 44: to keep the ground below a permanently refrigerated slab from freezing and heaving, which cracks the slab. Subfloor heating typically runs 1 to 2.5 BTU/h·ft² (3 to 8 W/m²), and that heat passes up through the insulation and becomes part of the refrigeration load.
Related Calculators
- Refrigeration Load Calculator: The component-level calculation that produces the total this page normalizes, covering transmission, product, internal, and infiltration gains.
- Cold Storage Door Infiltration: Infiltration through an opening as a single component of a refrigeration load, the adjacent case where heat arrives through a doorway rather than from above (article).
- Chiller Capacity Calculator: The plant capacity that has to remove the summed load once every component is added.
- Coil Capacity Calculator: The heat exchanger between the secondary brine circuit and the refrigerant.
- Refrigerant Charge Calculator: The charge in the primary circuit of the arena plant, which Standard 15 governs.
- Cooling Load Calculator: Conventional space loads for the seating bowl and the ancillary areas around the sheet.
- HVAC Heat Load Calculator: Transmission through the envelope of the arena building, a small term on the sheet and a large one on the hall.
- Ventilation Rate Calculator: Outdoor air supply, which drives both the convective and the latent shares and is the second thing checked on a TOO HIGH result.