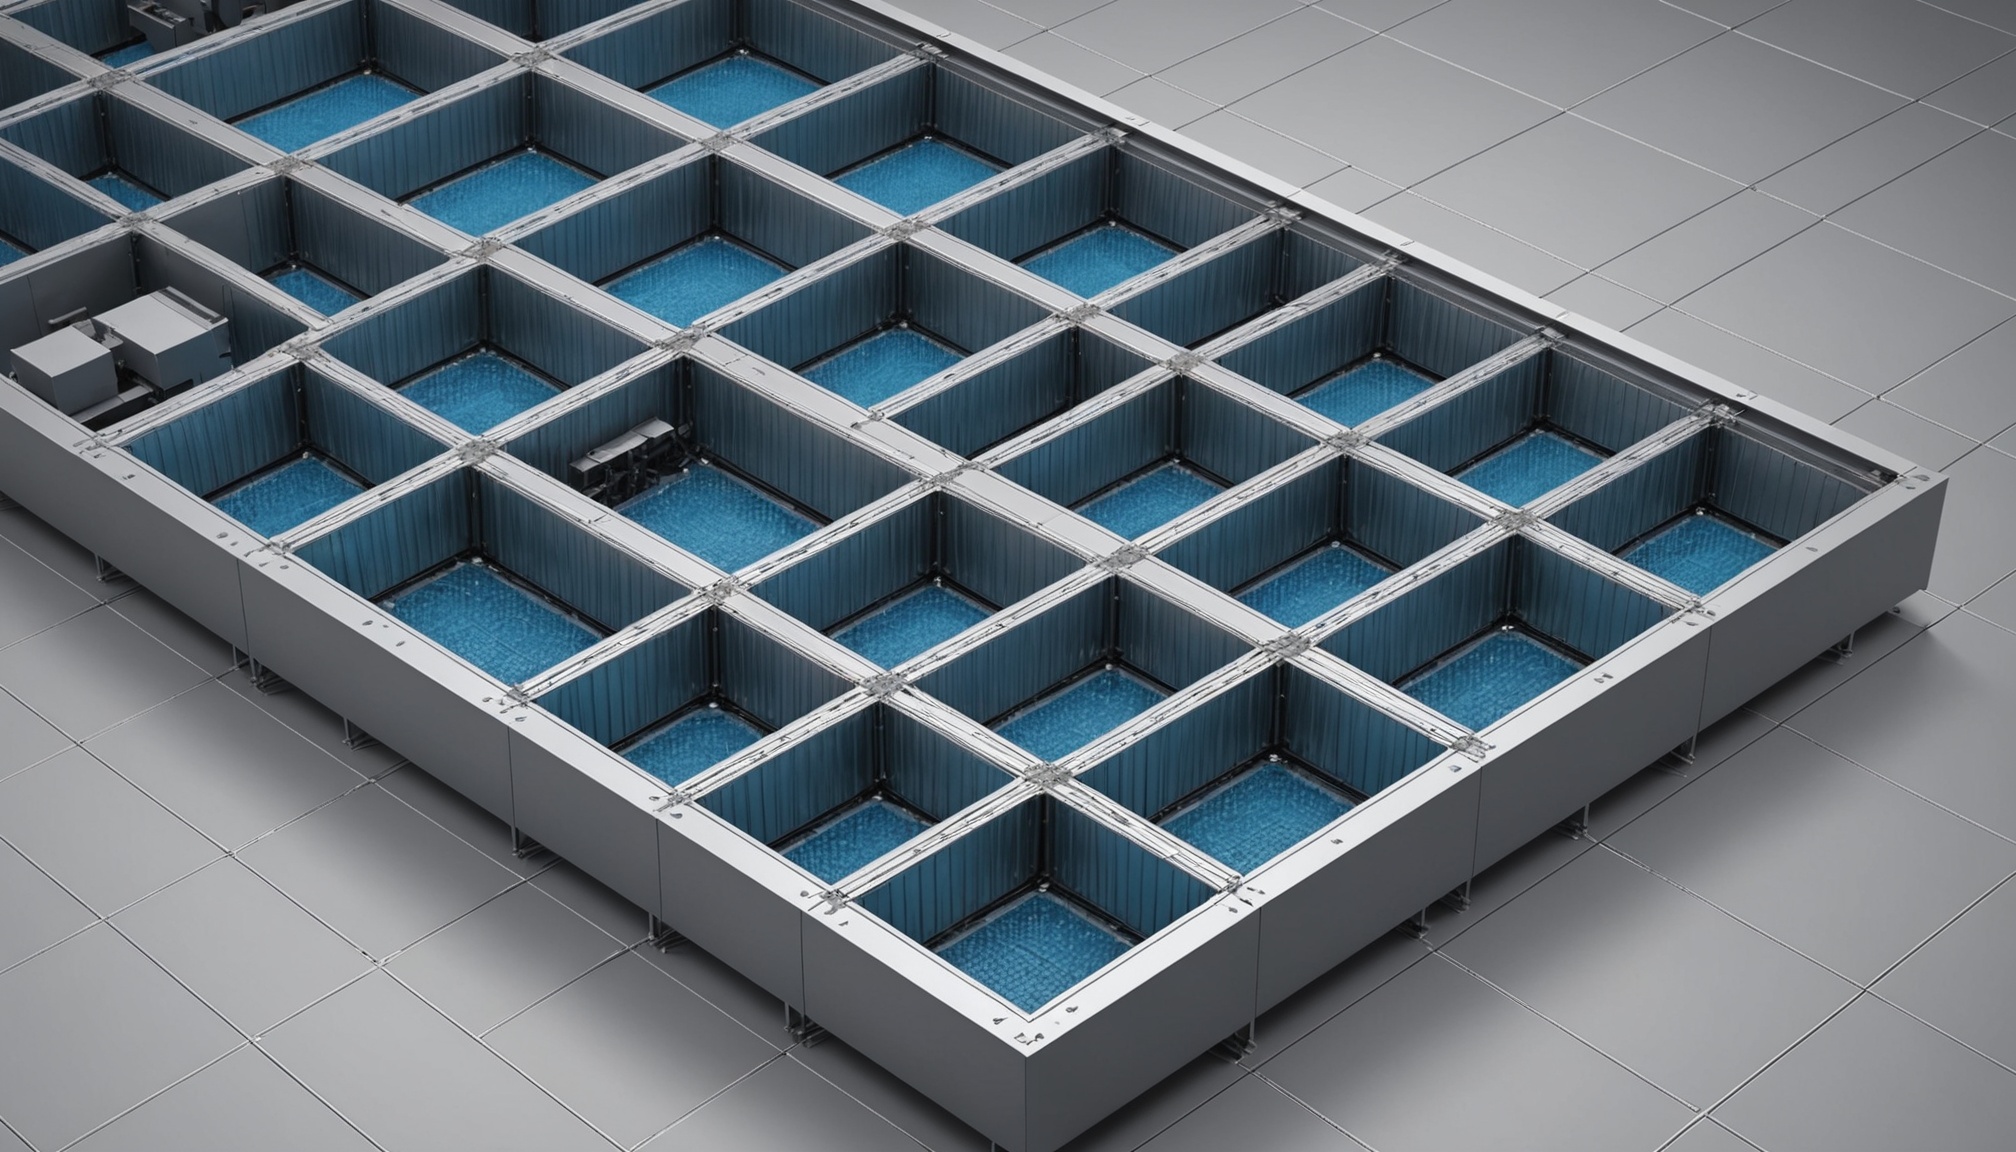
Why the Floor Tile Is the Airflow Bottleneck in an Underfloor System
In an underfloor air distribution system the perforated floor tile is the narrowest point the supply air passes through, so its pressure drop, set almost entirely by the open area of the tile, determines how much cold air actually reaches the rack in front of it.
The physics begin in the plenum. Cold supply air fills a pressurized cavity beneath the raised floor, then escapes upward through perforated tiles into the cold aisle. Each tile functions as an orifice: the air accelerates through the open holes, and that acceleration costs static pressure. Because the plenum runs at low static pressure (often below 25 Pa / 0.10 in.w.g. in UFAD systems), the tile's resistance is a large fraction of the available driving pressure. A tile with too little open area chokes the flow, delivering less air than the rack needs, while the plenum pressure it consumes starves other tiles in the same zone. The result is uneven airflow distribution and elevated rack inlet temperatures: the cold-side mirror of the recirculation problem that hot aisle containment addresses.
The calculator applies the orifice-flow relation to estimate the pressure drop across a single tile from the design airflow, the tile size, the free-area ratio, and a discharge coefficient. It reports gross panel area, free area, face velocity, and pressure drop with a low-to-very-high interpretation band. This is the supply-side airflow step in the data-center cooling chain: the Containment article addressed hot return air separation; this addresses cold supply distribution through the floor. Together, the two form the complete airflow-management pair. The calculator is a screening model; final tile selection uses manufacturer pressure-drop curves tested per ANSI/ASHRAE Standard 70, because real tile geometry (hole pattern, swirl vanes, integral dampers) affects the result beyond simple open area.
Calculator Inputs: Airflow, Panel Size, Free Area, Discharge Coefficient, Density
The calculator accepts seven inputs and returns the pressure drop picture for a single raised-floor tile.
Unit System. Imperial (CFM, inches, in.w.g.) or Metric (m³/h, mm, Pa). Internal calculations proceed in SI; outputs are converted to the selected system.
Design Airflow [CFM or m³/h]. The airflow required through this specific tile, matched to the rack or zone cooling demand it serves. From server fan data at operating load, or from the CRAC supply airflow at balance divided by the number of active tiles.
Panel Width [in or mm]. The raised-floor panel width, typically 24 in (600 mm). Standard data-center modules are 24 in square.
Panel Height [in or mm]. The other panel dimension, also typically 24 in (600 mm) for square tiles.
Free Area Ratio [%]. The percentage of the panel that is genuinely open: the holes that air actually passes through. Standard perforated tiles run 20-25%; high-flow perforated tiles run 40-56%; swirl diffusers run 15-25%. This is the most important input.
Discharge Coefficient Cd [dimensionless]. The flow-contraction and turbulence factor for the tile openings, ranging 0.5-0.8. Default 0.65 when the tile geometry is unknown.
Air Density [kg/m³]. Standard sea-level air at room temperature is approximately 1.2 kg/m³. Adjust for altitude or elevated supply temperature.
The calculation chain converts inputs to SI, computes the gross area and free area, then applies the orifice relation:
A_panel = W × H (gross area)
A_free  = A_panel × (FAR / 100)
Q [m³/s] = Q_input × conversion factor
V       = Q / A_free (face velocity through open area)
ΔP      = (Q / (Cd × A_free))² × (ρ / 2)
Interpretation bands (pressure drop):
< 5 Pa  (< 0.020 in.w.g.) — Low:       easy passage, minimal resistance
5-15 Pa (0.020-0.060)     — Moderate:  workable practical resistance
15-30 Pa (0.060-0.12)     — High:      restrictive, review free area or airflow
≥ 30 Pa  (≥ 0.12)         — Very High: strongly restrictive, design change needed
The calculator does not account for plenum pressure non-uniformity, multiple-tile interaction, exact manufacturer tile curves, damper position, room-side jet throw, floor-seam leakage, full-system static pressure, fan curve, or ASHRAE 70 lab-rated terminal performance. It is a single-tile orifice screening estimate.
The Orifice Model: Pressure Drop Through the Tile Opening
The tile is modeled as an orifice, and the pressure drop follows the standard opening-flow relation: it rises with the square of the airflow and falls with the square of the open area.
The governing equation, rearranged from the classic orifice-flow relation Q = Cd × A_free × √(2ΔP/ρ), solved for pressure drop:
ΔP = (Q / (Cd × A_free))² × (ρ / 2)

where:
  ΔP    = pressure drop [Pa]
  Q     = airflow rate [m³/s]
  Cd    = discharge coefficient [0.5-0.8, dimensionless]
  A_free = free (open) area [m²]
  ρ     = air density [kg/m³, typically 1.2 at sea level]
The physics: air forced through the tile openings accelerates, converting static pressure to velocity pressure, then losing some of that to vena contracta contraction and turbulence at the hole edges (captured by Cd). The static pressure drop is the velocity pressure at the free area, scaled by those losses.
The quadratic character is the key result:
Double the airflow (same tile) → 4× the pressure drop
Half the free area (same airflow) → 4× the pressure drop
Both enter as squares, so sensitivity is high in both directions
Per ASHRAE Fundamentals orifice theory, this is not a duct-friction problem. Duct friction loss distributes along length (Darcy-Weisbach with friction factor × length/diameter). Tile pressure drop is a single concentrated loss at the opening, independent of what comes above or below. The two phenomena are distinct.
Partial worked verification (Imperial example, full calculation in Section 11):
Q = 0.2832 m³/s, Cd = 0.65, A_free = 0.0929 m², ρ = 1.2 kg/m³
ΔP = (0.2832 / (0.65 × 0.0929))² × (1.2/2)
   = (0.2832 / 0.06039)² × 0.6
   = (4.689)² × 0.6 = 21.99 × 0.6 = 13.2 Pa (0.053 in.w.g.)
Per ASHRAE Fundamentals, Chapter 21, airflow through openings follows the orifice relation. The discharge coefficient and free area are the two dominant parameters, and both enter squared.
Free Area, Not Tile Size: The Quadratic That Governs the Result
The free area, the actually-open portion of the tile, is the single most influential input, because pressure drop varies with the inverse square of free area, so a small reduction in open area produces a large jump in pressure drop.
A_free = A_panel × FAR / 100   (free area from the ratio)
ΔP    ∝ 1 / A_free²            (inverse-square relationship)
The distinction between gross and free area matters:
Gross panel area: the full tile footprint (24 × 24 in = 4.0 ft² = 0.3716 m²)
Free area:        the open holes only (25% FAR → 1.0 ft² = 0.0929 m² open)
Airflow passes ONLY through the free area, not the full footprint
Using the gross area in place of free area (a common error on first-pass estimates) understates face velocity and pressure drop by a factor of (1/FAR)². At 25% FAR, that understatement is 16-fold in pressure drop.
The quadratic sensitivity, illustrated:
FAR 25% → A_free 0.0929 m² → some baseline ΔP
FAR 15% → A_free 0.0557 m² → ΔP scales as (25/15)² = (1.667)² = 2.78
Same airflow, same tile size: nearly triple the pressure drop
Typical free-area values by tile type (per manufacturer data and UFAD practice):
Standard perforated:  20-25% FAR
High-flow perforated: 40-56% FAR
Swirl diffuser:       15-25% FAR (varies with damper)
Solid tile:           0% FAR (no supply)
The design implication: choose high-flow tiles (40%+) for high-density racks where more airflow is needed and low tile ΔP is desirable. Use standard tiles (20-25%) where the rack load is moderate. Avoid restrictive tiles (15% or less) at supply locations unless the plenum pressure is sufficient to overcome the resistance.
Per ANSI/ASHRAE Standard 70 + UFAD design practice (Bauman & Daly, UFAD Design Guide, CBE Berkeley): free area, not tile footprint, governs pressure drop. That drop scales with the inverse square of open area. Reducing FAR from 25% to 15% nearly triples ΔP at the same airflow.
The Discharge Coefficient and Why It Is Never One
The discharge coefficient accounts for flow contraction and turbulence at the tile openings, and it is always less than one because real air cannot pass through an opening as cleanly as ideal orifice theory assumes.
Cd = discharge coefficient [0.5-0.8, default 0.65 when unknown]
ΔP ∝ 1 / Cd²   (pressure drop scales with the inverse square of Cd)
What the coefficient captures:
Vena contracta:  the flow contracts to less than the geometric hole area just past each opening
Edge turbulence: losses at the hole edges and hole-edge thickness
Net effect:      real effective area < geometric free area
A Cd of 1.0 would mean perfectly loss-free flow through the opening, which no real perforation produces. Using Cd = 1.0 understates pressure drop and over-estimates airflow delivery.
Typical values by opening geometry (per orifice theory and manufacturer testing):
Sharp-edged thin perforations:  Cd ≈ 0.60-0.65
Rounded or formed openings:     Cd ≈ 0.70-0.80
Default (unknown geometry):     Cd = 0.65 (mid-range screening)
The Cd sensitivity:
Cd 0.65 vs Cd 0.80: ΔP ratio = (0.80/0.65)² = 1.51
A low-Cd tile raises ΔP by ~51% compared to a high-Cd tile at the same free area
Manufacturer-tested tiles (ASHRAE 70 performance data) already embed the real discharge behavior in their published pressure-drop-vs-airflow curves. When manufacturer data is available, use it directly: the calculator's Cd is a stand-in for screening only. Per ANSI/ASHRAE Standard 70: Cd is never 1.0; pressure drop scales with 1/Cd². Manufacturer test curves are more accurate than the screening Cd.
Face Velocity and the Interpretation Bands
The face velocity, the speed of air through the open area of the tile, is the supporting output, and the pressure drop maps to interpretation bands that signal whether the tile is appropriately sized for the application.
V = Q / A_free (face velocity through the open area, not the gross tile)
Face velocity uses free area, not gross area, so it represents the actual speed of air passing through the perforations. High face velocity correlates with high pressure drop and can raise supply-jet noise and affect throw into the cold aisle.
Interpretation bands for pressure drop:
| ΔP (Pa) | ΔP (in.w.g.) | Band | Meaning |
|---|---|---|---|
| < 5 | < 0.020 | Low | Easy passage, minimal resistance |
| 5-15 | 0.020-0.060 | Moderate | Workable practical resistance |
| 15-30 | 0.060-0.120 | High | Restrictive, review free area or airflow |
| ≥ 30 | ≥ 0.120 | Very High | Choking, design change required |
The bands are most meaningful in context of the available plenum pressure. A 13 Pa moderate tile drop against a 25 Pa plenum consumes more than half the driving pressure. A 5 Pa low drop against the same plenum leaves 20 Pa for the airflow and distribution uniformity.
Worked velocity output (from the Imperial example, Section 11):
V = 0.2832 m³/s / 0.0929 m² = 3.05 m/s (600 fpm)
ΔP = 13.2 Pa (0.053 in.w.g.) → MODERATE band
Per UFAD practice: face velocity through the free area is the operative speed for pressure-drop assessment. The MODERATE band (5-15 Pa) is typical for standard 24-in tiles at conventional data-center airflows.
Low Plenum Pressure: Why Tile Resistance Is Critical in UFAD
Underfloor plenums run at low static pressure, often below 25 Pa (0.10 in.w.g.), so a tile pressure drop that would be negligible in a pressurized high-velocity duct system consumes a large fraction of the available driving pressure here.
The low-pressure operating point (per the ASHRAE UFAD Design Guide, Bauman & Daly):
UFAD plenum static: often < 25 Pa (< 0.10 in.w.g.)
Tile ΔP at 13 Pa:   ~52% of the plenum pressure consumed by one tile
Remaining pressure: ~12 Pa for flow uniformity and margin
UFAD plenums are large, low-velocity air reservoirs, not pressurized ducts. That geometry keeps fan power low (an energy advantage of UFAD), but it leaves little headroom for tile resistance. Every Pascal of tile ΔP is significant against a 25 Pa driving pressure, whereas the same 13 Pa would be irrelevant in a duct running at 125 Pa total static.
The consequence of restrictive tiles in a low-pressure plenum:
Restrictive tile (high ΔP) → less airflow through that tile than the rack needs
Raised plenum pressure to compensate → all other tiles on the floor re-balance
Net result: uneven airflow, elevated rack inlet temperatures, hot spots
The design balance principle:
Plenum pressure ≥ tile ΔP + distribution non-uniformity allowance
Tile free area chosen to keep ΔP within the plenum budget
Fan sized for total system: plenum pressure + tile drop + return path
Low plenum pressure and poor hot-aisle containment compound each other: weak supply delivery (inadequate tile area) and hot-exhaust recirculation (inadequate containment) both raise rack inlet temperature. Correcting only one half of the airflow-management pair leaves the other half's deficiency visible.
Per the ASHRAE UFAD Design Guide: UFAD plenums run at low static (typically below 25 Pa), so tile resistance is a large fraction of available driving pressure. Restrictive tiles starve airflow and unbalance the floor. Match tile free area so ΔP fits the plenum budget.
Tile Types and Airflow Balance Across the Floor
Because free area sets pressure drop, choosing tile types by their open area is the primary balancing mechanism for a raised floor, delivering more air to high-density racks and restricting it at low-density areas.
Tile types by free area (per manufacturer data, Tate, Schneider Electric, Upsite):
| Tile type | Free area | Typical use |
|---|---|---|
| Standard perforated | 20-25% | Moderate-density racks, general use |
| High-flow perforated | 40-56% | High-density racks (≥ 5 kW/rack) |
| Swirl diffuser | 15-25% | Comfort/mixing (office UFAD) |
| Grommet/cable cutout | Variable | Sealed cable passages, not supply |
| Solid tile | 0% | No supply (blank, walkway areas) |
The balancing logic:
High-density rack → high-flow tile (40%+): low ΔP, higher airflow delivery
Low-density rack  → standard tile (20-25%): more ΔP, less airflow
Empty/no-load area → solid tile (0%): no wasted plenum air
At a common plenum pressure, a high-free-area tile passes more air (lower resistance). A low-free-area tile passes less. Matching tile free area to the rack heat load, row by row, distributes air proportionally to where the heat is generated. This is the cold-supply counterpart to hot-aisle containment's hot-return separation.
The over-tiling failure mode:
Too many high-flow tiles in the floor → total tile conductance exceeds fan capacity
→ plenum pressure collapses → every tile under-delivers
Balance total open area against available fan curve and plenum pressure
Unlike ducted systems, which use dampers, UFAD balancing is largely achieved through tile selection and placement. Moving or swapping tiles re-balances airflow distribution without any ductwork modification, giving facility operators a practical tuning lever.
Per ASHRAE 70 + UFAD design practice (ASHRAE TC 9.9): tiles are chosen by free area to balance airflow, high-flow (40%+) at high-density racks, standard (20-25%) elsewhere, solid where there is no load. Over-tiling collapses plenum pressure. Tile placement and selection are the balancing tools.
Nominal versus Tested Free Area
The free-area ratio that governs the pressure-drop calculation should come from manufacturer test data, not the nominal perforation pattern, because the measured effective free area often differs from the geometric open area.
The distinction:
Nominal free area: geometric open area calculated from hole size, pitch, and count
Tested free area (ASHRAE 70): measured effective area from performance testing
These differ: tested is the value that governs real pressure drop
Why they differ (per orifice theory):
Hole geometry, edge radius, and plate thickness all affect Cd
Swirl vanes and integral dampers reduce effective area further
The geometric percent is not equivalent to the flow-effective percent
ANSI/ASHRAE Standard 70 (Method of Testing the Performance of Air Outlets and Inlets) provides standardized laboratory testing of tiles under controlled flow conditions, yielding measured pressure-drop-vs-airflow curves. Those curves embed both the real free area and the real discharge losses in the tested performance, without separating them into Cd and FAR. The manufacturer datasheet built from ASHRAE 70 testing is the authoritative source for final tile selection.
The screening gap:
Calculator: uses nominal FAR + screening Cd → approximate ΔP for first-pass sizing
Manufacturer data: tested ΔP-vs-flow curve → confirmed performance for procurement
Workflow: screen first with the calculator; confirm with manufacturer data
Practical rule: always take the free-area ratio from the manufacturer datasheet for the specific tile model, not from the geometric hole pattern in a catalog image. The test-derived value captures what the tile actually delivers.
Per ANSI/ASHRAE Standard 70 + manufacturer practice: use the tested free area, not the nominal perforation percent. Effective flow area differs from geometric open area. The calculator screens with nominal values; manufacturer curves govern final selection.
Worked Example: 600 CFM Through a 24-Inch Tile at 25 Percent Free Area
Scenario. Standard perforated raised-floor tile, 24 in × 24 in, design airflow 600 CFM, free-area ratio 25%, discharge coefficient Cd 0.65, air density 1.2 kg/m³. This is the calculator's Imperial example.
Step 1. Gross panel area.
A_panel = (24 × 24) / 144 = 4.0 ft² = 0.3716 m²
Step 2. Free area.
A_free = 0.3716 × 0.25 = 0.0929 m² (1.0 ft²)
Step 3. Airflow conversion.
Q = 600 CFM × 0.000471947 = 0.2832 m³/s
Step 4. Face velocity.
V = 0.2832 / 0.0929 = 3.05 m/s (600 fpm)
Step 5. Pressure drop.
ΔP = (0.2832 / (0.65 × 0.0929))² × (1.2 / 2)
   = (0.2832 / 0.06039)² × 0.6
   = (4.689)² × 0.6
   = 21.99 × 0.6
   = 13.2 Pa
Step 6. Convert to inches water gauge.
ΔP = 13.2 × 0.004015 = 0.053 in.w.g.
Step 7. Interpretation band.
13.2 Pa (0.053 in.w.g.) → MODERATE (5-15 Pa band)
Consistent with a standard 25% perforated tile at 600 CFM.
Step 8. Against plenum pressure.
If plenum = 25 Pa: tile consumes 13.2 Pa (~53%), leaving ~12 Pa margin.
Workable for moderate-density racks; a denser rack needing more airflow would push into HIGH.
Step 9. Face velocity sanity check.
600 fpm through the openings is a reasonable perforated-tile face velocity.
Values above 1000 fpm typically raise supply-jet noise and directional throw.
Step 10. Decision.
600 CFM, 24-in tile, 25% FAR: ΔP 13.2 Pa (0.053 in.w.g.), MODERATE, 600 fpm face velocity.
For a high-density rack requiring more than 600 CFM, a 40%+ high-flow tile would lower ΔP
and increase delivery at the same plenum pressure.
Screening result; confirm against manufacturer ASHRAE 70 tile performance data.
This supply air is what hot-aisle containment (Containment article) keeps separated from the hot return. The 600 CFM airflow matches the server-rack heat load (Server Rack Heat Load article) it is sized to cool.
Free-Area Sensitivity and the Metric Example
Free-area sensitivity (illustrating the inverse-square relationship).
The same 600 CFM through the same 24-in tile, but with a 15% FAR tile (fewer or smaller holes):
Step 1. Free area at 15% FAR:
A_free = 0.3716 × 0.15 = 0.0557 m²  (0.6 ft²)

Step 2. Scale using the inverse-square relationship:
ΔP_15 = ΔP_25 × (FAR_25 / FAR_15)²
       = 13.2 × (25/15)²
       = 13.2 × (1.667)²
       = 13.2 × 2.78
       = 36.7 Pa  (0.147 in.w.g.)

Step 3. Band:
36.7 Pa → VERY HIGH (≥ 30 Pa band)
The result: a 40% reduction in free area (25% to 15%), same airflow and same tile size, nearly triples the pressure drop and pushes the result from MODERATE into VERY HIGH. At a 25 Pa UFAD plenum, a 36.7 Pa tile drop exceeds the available driving pressure; the tile would starve. Free area is the dominant design variable.
Metric example (calculator Metric case).
Airflow: 1000 m³/h, panel: 600 mm × 600 mm, FAR: 25%, Cd: 0.65, ρ: 1.2 kg/m³

Step 1. Areas:
A_panel = 0.6 × 0.6 = 0.36 m²
A_free  = 0.36 × 0.25 = 0.09 m²

Step 2. Airflow:
Q = 1000 / 3600 = 0.2778 m³/s

Step 3. Face velocity:
V = 0.2778 / 0.09 = 3.09 m/s

Step 4. Pressure drop:
ΔP = (0.2778 / (0.65 × 0.09))² × (1.2/2)
   = (0.2778 / 0.0585)² × 0.6
   = (4.749)² × 0.6
   = 22.55 × 0.6
   = 13.5 Pa

Step 5. Interpretation:
13.5 Pa → MODERATE (5-15 Pa band)
The metric case mirrors the Imperial result (600 mm ≈ 23.6 in, 1000 m³/h ≈ 589 CFM), both landing at 13.2-13.5 Pa moderate. Free area is the lever; tile size and airflow set the baseline. The inverse-square sensitivity (25% to 15% nearly triples ΔP) holds identically in metric.
Per orifice physics: reducing free area from 25% to 15% takes ΔP from 13.2 Pa to 36.7 Pa (moderate to very high) via the inverse-square relation. The metric case (1000 m³/h, 600 mm, 25%) gives 13.5 Pa moderate, mirroring the Imperial example.
Application Boundaries: Plenum Non-Uniformity, Multiple Tiles, Manufacturer Data
The calculator is applicable for single-tile orifice pressure drop screening using nominal free area and a screening discharge coefficient. Several conditions fall outside that scope.
Plenum Pressure Non-Uniformity. The model assumes a uniform driving pressure at every tile location. Real underfloor plenums have a pressure field that varies with distance from the CRAC/CRAH units, floor obstructions, depth, and cable trays. The local static at a tile near the CRAC differs from one at the far end of the plenum. CFD modeling or detailed plenum pressure surveys capture that variation.
Multiple-Tile Interaction. The model sizes one tile in isolation. In a real floor, many tiles share the same plenum; opening additional high-flow tiles lowers the plenum pressure, reducing every tile's delivery simultaneously. Whole-floor balance is a system-level calculation, not a single-tile calculation.
Manufacturer Tile Curves. The orifice model uses nominal free area and a screening Cd. Real tiles have tested pressure-drop-vs-airflow performance curves from ASHRAE 70 testing that reflect exact perforation pattern, hole geometry, swirl vanes, and damper position. Use manufacturer curves for final tile selection and procurement.
Damper Position. Tiles with integral dampers vary their effective free area with damper angle. A partially throttled damper raises the pressure drop above the nominal open-tile value. Damper position is not an input.
Room-Side Jet and Comfort. The model addresses pressure drop at the tile, not the supply jet's throw, spread, or room-side velocity distribution. Relevant for office UFAD comfort design; the data-center focus is cold-aisle delivery, not comfort.
Floor-Seam Leakage. The model assumes all plenum air exits through the tile free area. Real raised floors leak at panel seams, cable cutouts, and grommet openings. That bypass reduces effective tile delivery and lowers the plenum-to-tile pressure differential.
Fan and Full-System Static. The model quantifies one tile's resistance. The fan must overcome the full system: plenum pressure, tile drop, cold-aisle distribution, and return path. Fan-curve analysis is separate.
Altitude and Temperature. Air density affects the result. Standard 1.2 kg/m³ is sea-level at approximately 20°C. At altitude or elevated supply temperature, adjust ρ; the model accepts any density value.
Per ANSI/ASHRAE Standard 70 + ASHRAE UFAD Design Guide: the calculator is single-tile orifice screening. Plenum non-uniformity, multiple-tile interaction, manufacturer curves, dampers, jet throw, seam leakage, fan/system static, and lab-rated performance require separate analysis. A qualified mechanical engineer and manufacturer performance data confirm the final tile selection.
Raised Floor Pressure Drop Calculator
Raised floor pressure drop by the orifice model: the calculator converts the gross tile area to free area with the free-area ratio, then computes face velocity and the pressure drop from ΔP = (Q/(Cd × A_free))² × (ρ/2), the standard opening-flow relation. It reports free area, face velocity, and pressure drop with a low-to-very-high interpretation band. Because pressure drop scales with the inverse square of free area, that ratio dominates the result. A screening estimate for UFAD and data-center tile selection; confirm against manufacturer data tested per ANSI/ASHRAE Standard 70, since real tile geometry (hole pattern, swirl vanes, damper position) affects the actual static pressure loss.
Raised floor tile pressure drop by the orifice model (ΔP = (Q/(Cd × A_free))² × (ρ/2)). Converts gross tile area to free area, reports face velocity, pressure drop, and a low-to-very-high interpretation band. Metric and Imperial units. UFAD and data-center tile selection screening per ANSI/ASHRAE Standard 70.
Open Raised Floor Pressure Drop CalculatorFAQ
How is raised floor tile pressure drop calculated?
Per orifice theory and ASHRAE Fundamentals, Chapter 21: by the opening-flow relation ΔP = (Q/(Cd × A_free))² × (ρ/2). Airflow passes through the tile's free area, and pressure drop rises with the square of flow and the inverse square of open area. The discharge coefficient (0.5-0.8) accounts for contraction and turbulence at the openings.
Why is free area more important than tile size?
Per ANSI/ASHRAE Standard 70: airflow passes only through the open holes, not the tile footprint. Pressure drop scales with the inverse square of free area, so a 40% reduction in open area (25% FAR to 15% FAR) nearly triples the pressure drop at the same airflow. Tile footprint determines gross area only; free area determines resistance.
What is a typical UFAD plenum pressure?
Per the ASHRAE UFAD Design Guide (Bauman and Daly, CBE Berkeley): often below 25 Pa (0.10 in.w.g.). Because the plenum runs at low static pressure, a moderate tile pressure drop of 13 Pa consumes more than half the available driving pressure, so tile resistance matters more than it would in a conventional high-pressure duct system.
Why is the discharge coefficient less than one?
Per orifice theory: real air contracts and turbulates when passing through openings (the vena contracta effect), so the effective flow area is less than the geometric open area. Cd runs 0.5-0.8 depending on hole geometry; it is never 1.0. Pressure drop scales with 1/Cd², so a low-Cd tile produces significantly higher resistance than a high-Cd tile at the same nominal free area.
How do I balance airflow across a raised floor?
Per UFAD design practice and ASHRAE TC 9.9: choose tiles by free area: high-flow tiles (40%+) at high-density racks, standard tiles (20-25%) at moderate-density areas, solid tiles where there is no IT load. Over-tiling (too much total open area) collapses the plenum pressure and under-delivers at every tile. Tile placement and type selection are the primary balancing tools.
Should I use nominal or tested free area?
Per ANSI/ASHRAE Standard 70: tested. The nominal perforation percent (geometric open area from the hole pattern) differs from the flow-effective free area measured under the ASHRAE 70 laboratory protocol. Always take the free-area ratio from the manufacturer datasheet for the specific tile model, not the geometric estimate from a catalog.
Is this a certified tile selection tool?
Per ANSI/ASHRAE Standard 70: no. The calculator is a screening estimate using a simplified orifice model with a nominal free area and a screening Cd. Final selection uses manufacturer pressure-drop-vs-airflow curves tested per ASHRAE 70, which capture real perforation geometry, swirl vanes, and damper characteristics. Use the calculator for first-pass screening; use manufacturer data and a qualified engineer for final procurement.
Related Calculators
- Hot Aisle Containment Efficiency Calculator: The hot-return airflow separation that pairs with this cold-supply distribution (article).
- Data Center CRAC Redundancy Calculator: Single-failure cooling survivability behind the plenum supply (article).
- CRAC Unit Sizing Calculator: The cooling capacity delivered through these floor tiles (article).
- Server Rack Heat Load Calculator: Per-rack heat that sets the airflow each tile must deliver.
- Static Pressure Calculator: System static pressure the fan must overcome, including tile drop.
- CFM Calculator: Airflow demand feeding the tile pressure-drop input.
- Air Velocity Calculator: Face and duct velocities in the airflow path.
- Fan Power Calculator: Fan power to drive the plenum and overcome tile resistance.
References
- ANSI/ASHRAE Standard 70-2006 (RA 2016), Method of Testing the Performance of Air Outlets and Inlets. ASHRAE, Atlanta, GA. (tile pressure-drop testing protocol, tested free area, certified terminal performance)
- Bauman, F. S., and Daly, A. (2003). Underfloor Air Distribution (UFAD) Design Guide. ASHRAE/CBE, Atlanta, GA. (UFAD plenum pressure, tile selection, airflow balance, low-static-pressure operating point)
- ASHRAE Handbook: Fundamentals, 2021 ed., Chapter 21 (Duct Design) and Chapter 3 (Fluid Flow). ASHRAE, Atlanta, GA. (orifice-flow relation, discharge coefficient, opening-flow pressure drop)
- ASHRAE Technical Committee TC 9.9. Data Center Networking Equipment — Issues and Best Practices (2011) and Thermal Guidelines for Data Processing Environments, 4th ed. (2015). ASHRAE, Atlanta, GA. (rack-inlet temperature envelopes, airflow management)
- Tate Access Floors. Perforated Access Floor Panel Product Data Sheets. (free-area values: 20%, 25%, 40%, 56% FAR perforated tiles; high-flow tile specifications)
- Schneider Electric. Raised Floor Design for Data Centers: Tile Selection and Airflow Balancing. APC White Paper #158. (over-tiling, plenum pressure collapse, tile free area recommendations)
- Upsite Technologies. Blanking Panels and Floor Tile Placement for Airflow Management. (tile placement, seam leakage, bypass flows)
- ISO 14644-16:2019, Cleanrooms and associated controlled environments — Part 16: Energy efficiency in cleanrooms. ISO, Geneva. (cross-reference: raised-floor systems in cleanroom environments)