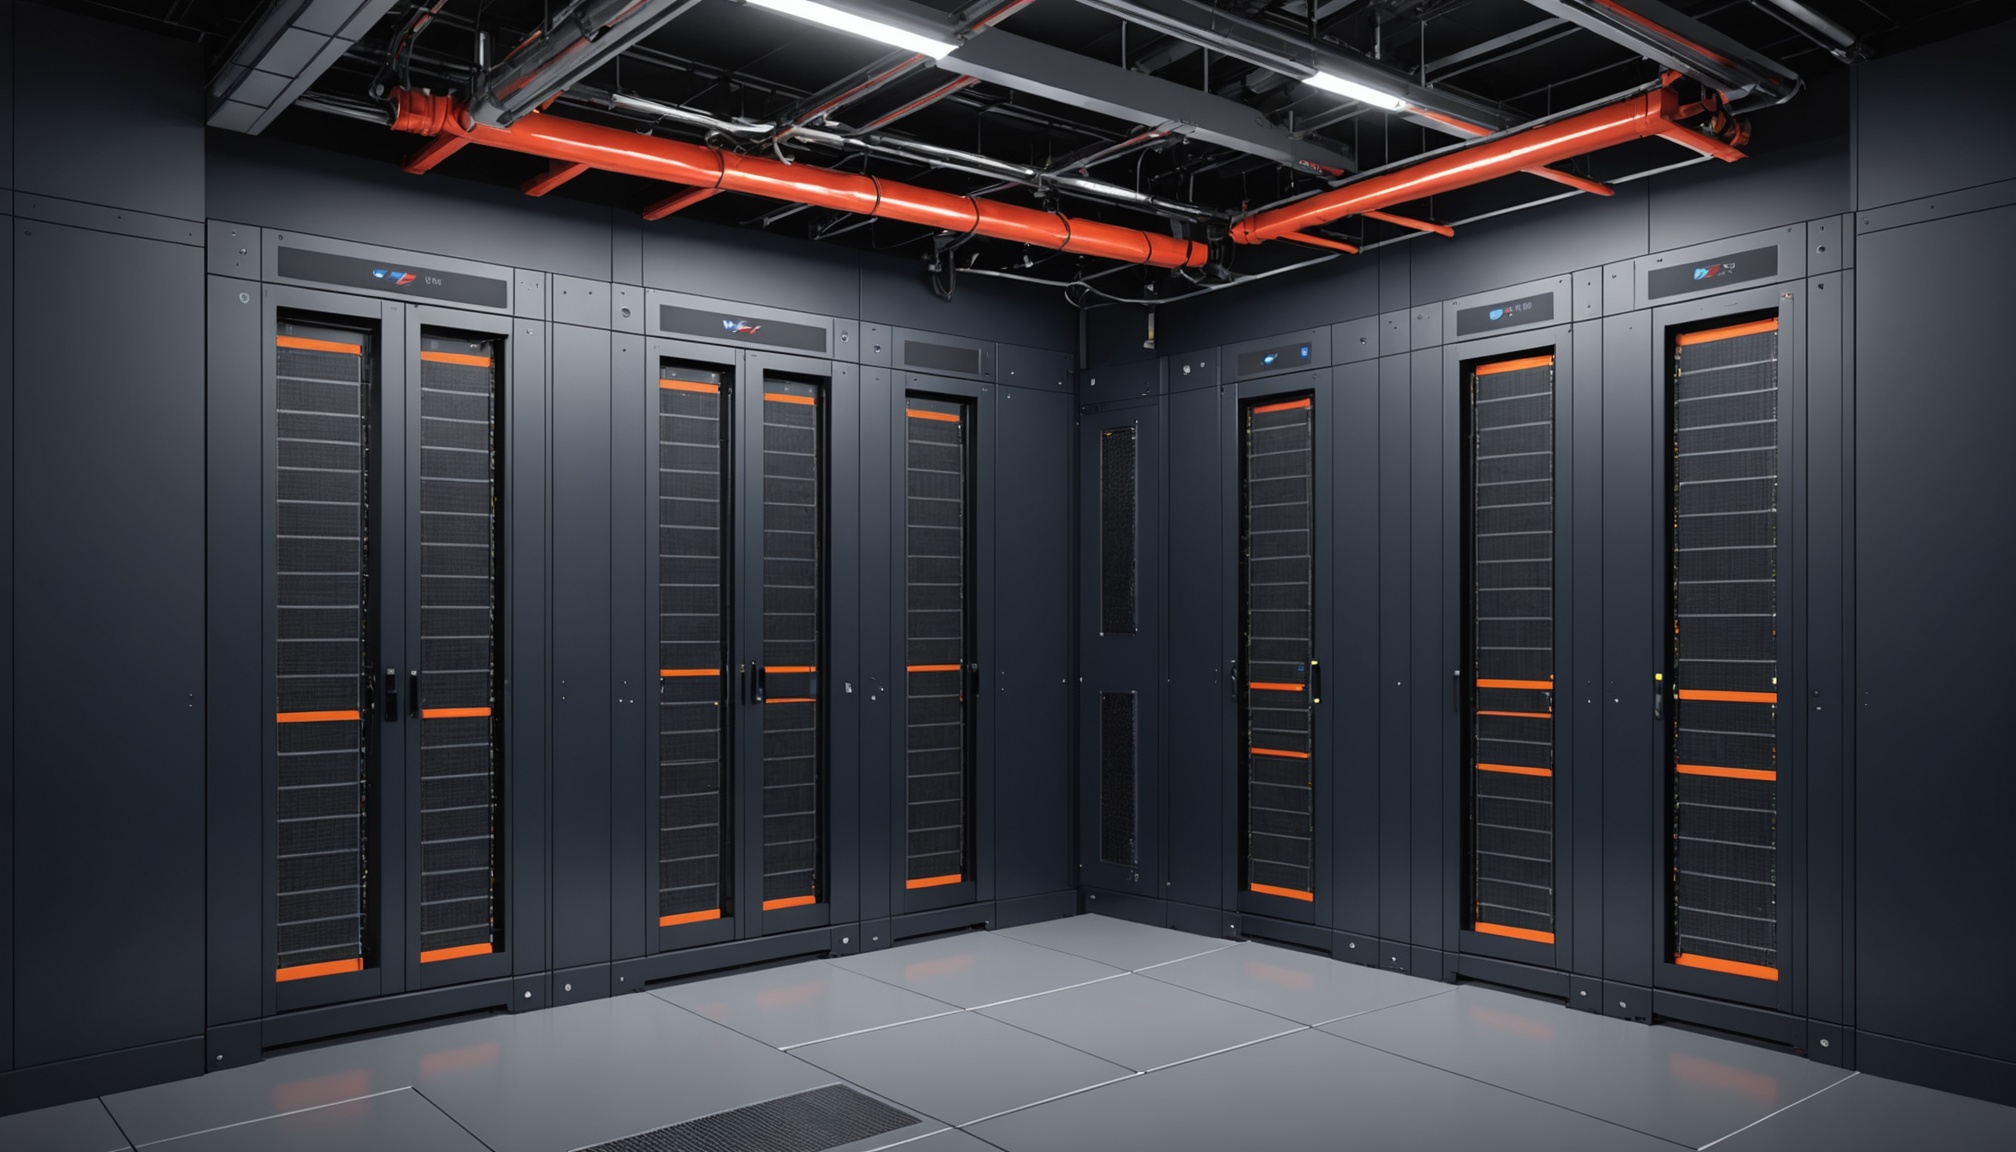
Why Cooling Capacity Means Nothing Until the Air Reaches the Rack
A data center can have every ton of cooling it needs and still overheat, because capacity only matters if the cold air actually reaches the server inlets and the hot exhaust actually returns to the cooling units, and containment is what keeps those two air streams from mixing.
The physics of an uncontained room work against efficiency. Without containment, hot exhaust from the back of a rack drifts over the top and around the ends and mixes with the cold supply feeding the front of the next rack. That recirculation raises the rack inlet temperature even though the room, on average, is cool enough. The cooling units then work harder to overcome air they are fighting rather than cooling the load. Containment (a physical barrier around the hot aisle, with roof panels and end doors) keeps the hot exhaust in a dedicated return path so it goes back to the cooling units without contaminating the cold supply. Containment efficiency measures how well that separation works, as the fraction of rack exhaust that stays contained.
The calculator divides the effectively contained hot airflow by the total rack exhaust airflow to give a containment efficiency percentage, with the remainder as leakage, then classifies the result from too low to excellent. This is the airflow-delivery step in the data-center cooling workflow. The CRAC Sizing article set the capacity and noted that capacity is not delivery; the Redundancy article confirmed the units survive a failure. This article addresses whether the cooled air actually gets to the racks. ASHRAE TC 9.9 defines the rack-inlet envelope that good containment protects.
Calculator Inputs: Total Rack Exhaust and Effectively Contained Airflow
The calculator accepts three inputs and returns the containment efficiency picture.
Unit System. Imperial (CFM) or Metric (m³/h). The ratio is dimensionless, so the percentage is identical in either system.
Total Rack Exhaust Airflow (CFM or m³/h). The total hot exhaust discharged by the IT racks into the aisle. Equals the total supply airflow through the servers at steady state: what goes in comes out, heated. From server fan data at operating load, or from CRAC/CRAH supply airflow at balance.
Effectively Contained Hot Aisle Airflow (CFM or m³/h). The portion of that exhaust that stays within the intended hot-return path without mixing into the cold side. Obtained from return-capture measurement, or from total airflow minus quantified leakage from an airflow survey or thermal imaging.
Calculator outputs: Containment Efficiency (%) = contained / total × 100; Estimated Leakage (%) = 100 minus efficiency; and a status badge (TOO LOW / LOW-MARGINAL / RECOMMENDED / HIGH / EXCELLENT).
Both values must be measured at the same IT load and rack population. Mixing load states gives an invalid ratio.
The calculator does not account for rack-inlet temperature directly (efficiency is airflow, not temperature), CFD or transient behavior, specific leakage-path breakdown, underfloor bypass (raised-floor), return-air routing verification, rack load distribution, cooling capacity or redundancy, humidity, RCI/RTI indices, or commissioning measurement. It is a screening metric.
The Containment Efficiency Ratio and Its Leakage Complement
Containment efficiency is a simple ratio: the contained hot airflow over the total rack exhaust, and its complement is the leakage that escapes into the cold side.
Containment Efficiency (%) = (Contained Hot Airflow / Total Rack Exhaust) × 100
Estimated Leakage (%)      = 100 − Containment Efficiency
Worked example (Example 1):
Contained = 910 CFM (1,546 m³/h), Total = 1,000 CFM (1,699 m³/h)
Efficiency = (910 / 1,000) × 100 = 91.0%
Leakage    = 100 − 91.0 = 9.0%
What the ratio means:
91% of the hot exhaust stays in the contained return path
9%  leaks into the cold supply (recirculation) or bypasses the load
100% = perfect separation (ideal, unreachable in practice)
The metric is a mass-airflow ratio, how much air is contained, not how hot it is. A high containment efficiency keeps the streams separated; the resulting rack-inlet temperature depends on that separation plus the supply temperature (Section 9). Because it is a ratio of two airflows in the same units, the percentage is the same whether CFM or m³/h.
The leakage is the actionable number: efficiency describes success; leakage points at the problem. A 9% leakage says 9% of the hot air is contaminating the cold side, worth chasing to specific paths. Perfect separation is unreachable in real systems: panel gaps, cable openings, and aisle ends always leak somewhat. Excellent (above 98%) is the practical ceiling.
Per airflow-management practice and The Green Grid: containment efficiency equals contained over total exhaust times 100; leakage is the complement. A dimensionless airflow ratio; leakage is the actionable figure.
The Interpretation Bands: Too Low to Excellent
The calculator maps the efficiency percentage to a fixed interpretation, so a number becomes a judgment about whether the containment is acceptable.
| Efficiency | Status |
|---|---|
| Below 70% | TOO LOW |
| 70% to below 85% | LOW / MARGINAL |
| 85% to 95% | RECOMMENDED |
| Above 95% to 98% | HIGH |
| Above 98% | EXCELLENT |
Band by band: below 70% (too low) means severe leakage, major recirculation, hot spots likely; containment is not doing its job and the paths must be found. The 70 to 85% band (low/marginal) indicates meaningful leakage, cooling working harder than needed; improvement is worthwhile. The 85 to 95% band (recommended) is the practical target for most contained aisles: good separation, acceptable leakage. The 95 to 98% band (high) shows strong separation, low recirculation, efficient. Above 98% (excellent) is near-ideal, minimal mixing, the practical ceiling.
85–95% is the design target for typical containment
Below 85% invites hot-spot and efficiency problems
Above 95% is achievable with disciplined sealing (blanking panels, grommets, end doors)
Boundary handling: 70% reads as low/marginal, 85% as recommended, 95% as recommended, 98% as high (inclusive lower edges per the calculator). Diminishing returns appear near the top: pushing from 95% to 99% costs sealing effort for a small leakage reduction; worthwhile in high-density or high-efficiency targets, less so elsewhere.
Per airflow practice: efficiency maps to bands, recommended 85 to 95%, high 95 to 98%, excellent above 98%, too low below 70%. The recommended band is the design target; below 85% invites hot spots.
Recirculation versus Bypass: Two Ways Air Escapes Containment
Leakage takes two distinct forms, recirculation and bypass, and they harm cooling in opposite directions, so knowing which one dominates points at the fix.
Recirculation: hot exhaust leaks BACK to the cold side and re-enters rack inlets
               → raises rack inlet temperature (the dangerous one)
Bypass:        cold supply air escapes to the return WITHOUT passing through the racks
               → wastes cooling, lowers return temperature, hurts efficiency
Recirculation is a reliability problem. Hot exhaust escapes containment (over racks, around ends, through gaps), mixes into cold supply, and raises the temperature of air entering servers. This is the direct cause of hot spots and thermal events.
Bypass is an efficiency problem. Cold supply air escapes to the return path without cooling any load; common with underfloor leakage, unsealed cutouts, and over-supply. It wastes fan and cooling energy, and lowers return temperature, which hurts CRAC efficiency.
The direction of failure matters because the fix differs. Recirculation demands sealing the hot-to-cold paths; bypass demands sealing the cold-to-return paths or balancing supply. Both lower containment efficiency, but not in the same direction.
A useful return-temperature clue: low return temperature at the cooling unit often signals bypass (cold air short-circuiting before it reaches the load); hot rack inlets signal recirculation.
This calculator's metric (contained / total exhaust) most directly reflects recirculation control, because it measures how much hot air stays contained. Bypass shows up more clearly in supply-side airflow metrics.
Per The Green Grid and airflow practice: leakage is recirculation (hot to cold, raises rack inlets, reliability problem) or bypass (cold to return, wastes cooling, efficiency problem). Containment efficiency reflects recirculation control most directly; the failure direction points at the fix.
The Leakage Paths: Where Contained Air Actually Goes
Containment efficiency is lost through a handful of specific physical paths, and improving it is a matter of finding and sealing them, not adding cooling.
Aisle-end gaps. Open ends of a hot aisle let hot air escape horizontally into adjacent cold aisles. End doors close them.
Cable cutouts. Floor or rack openings for cabling let air leak between zones. Brush grommets seal them.
Blanking-panel gaps. Empty rack U-positions without blanking panels let hot air pass front-to-back through the rack (Section 8).
Panel-continuity breaks. Discontinuous overhead or side containment panels leave openings. Completing the barrier closes them.
Bypass from non-contained paths. Air exiting rack tops or sides outside the contained aisle, or underfloor leakage on raised-floor systems.
Imperfect return-air capture. Return grilles or CRAC/CRAH intakes that do not fully capture the contained exhaust.
Finding them uses thermal imaging (hot signatures on the cold side at gaps), boundary airflow measurement (quantifies leakage at ends, tops, cutouts), and smoke or tracer visualization. Row-end openings, missing blanking panels, and unsealed cutouts often account for most leakage. Even small gaps, multiplied across a room, add up to double-digit leakage percentages.
Sealing is cheap: blanking panels, brush grommets, end doors, and panel completion are inexpensive relative to cooling capacity. Containment improvement is one of the highest-return airflow measures. Containment efficiency is a before/after metric: seal a path, re-measure, confirm the improvement.
Per Upsite Technologies and The Green Grid: containment is lost through aisle-end gaps, cable cutouts, missing blanking panels, panel breaks, and imperfect return capture. Thermal imaging and boundary airflow find them. Sealing is cheap relative to cooling; re-measure to confirm.
Blanking Panels and the Cheapest Containment Wins
The single highest-return containment measure is the blanking panel, a filler plate in empty rack positions, because an open U-position lets hot exhaust short-circuit straight through the rack to the inlet side.
An empty rack U-position (no equipment, no blanking panel) is an open hole. Hot exhaust flows back-to-front through it, straight to the cold-side inlets. A few open U-positions per rack can recirculate significant hot air back into the supply stream.
Blanking panels: snap-in or screw-in filler plates that close empty U-positions
Force air to pass through equipment, not around it
Cost: a few dollars each; fast to install; high impact on containment efficiency
Brush grommets seal cable cutouts; rack skirts and side panels close under-rack and between-rack gaps. Together with blanking panels, they seal rack-level leakage.
The compounding effect matters: blanking panels, grommets, and end doors each add a few percent of containment efficiency; together they move a room from marginal to recommended without touching the cooling plant. Vendor guidance from Upsite Technologies consistently identifies blanking panels as the first airflow-management step, because the return on cost is immediate.
Order of operations: seal rack-level leakage (blanking panels, grommets) before adding containment structure or cooling. The cheapest measures come first.
Per Upsite Technologies and airflow practice: blanking panels close empty rack U-positions that short-circuit hot exhaust to inlets, the highest-return containment measure. With brush grommets and end doors, they seal rack-level leakage cheaply, often moving a room from marginal to recommended.
Recirculation and the Rack-Inlet Temperature Penalty
The reason containment efficiency matters for reliability is that recirculated hot air raises the rack inlet temperature above the supply temperature, and the rack inlet, not the room average, is what ASHRAE TC 9.9 governs.
Rack inlet temp = supply temp + recirculation penalty
Poor containment (high leakage) = larger penalty = hotter inlets
The room average misleads. A data hall can average an acceptable temperature while specific rack inlets exceed the envelope. Recirculation concentrates at the top of racks and row ends, where leakage paths converge, producing the worst inlet temperatures at the highest-heat equipment.
ASHRAE TC 9.9 sets the recommended rack inlet envelope at 18 to 27°C (64 to 81°F). Recirculation from poor containment can push top-of-rack inlets above this envelope even with cool supply, because the mixed air entering the top of the rack is warmer than the supply delivered at the bottom.
The connection to the capacity workflow: the CRAC Sizing article noted that capacity is not delivery. Containment is the delivery mechanism. Adequate capacity plus poor containment equals hot inlets, because the cooled air never cleanly reaches the servers. Running warmer supply air (for energy savings, per ASHRAE 90.4) leaves less recirculation margin, so good containment becomes more important to keep inlets in-envelope.
The Green Grid's Rack Cooling Index (RCI) and Return Temperature Index (RTI) quantify how well inlet temperatures stay in-envelope and how airflow matches load. Containment efficiency supports both by keeping streams separated.
Per ASHRAE TC 9.9 and The Green Grid: recirculation from poor containment raises rack inlet temperature above supply, and the rack inlet (recommended 18 to 27°C, 64 to 81°F) governs, not the room average. Containment is the delivery mechanism capacity depends on. Warmer supply raises the stakes.
The Energy Case: Why Containment Lowers PUE
Beyond reliability, containment saves energy, because separating the air streams lets the cooling units run warmer, run less, and enables economizer hours, all of which lower the cooling share of PUE.
The four energy levers containment activates:
1. Higher return temperature: contained hot air returns hot, raising CRAC sensible
   capacity and efficiency (bigger ΔT across the coil)
2. Higher supply temperature: less recirculation margin needed; supply can be raised
   within the TC 9.9 envelope, reducing refrigeration energy
3. Economizer hours: warmer operation enables more free-cooling hours (air-side or
   water-side economizer)
4. Lower fan energy: no over-supply needed to fight recirculation
Bypass does the opposite of benefit 1: cold supply air short-circuiting to the return lowers the return temperature, reducing the cooling unit's sensible capacity and efficiency. Containment that eliminates bypass keeps the return air hot.
PUE = total facility power / IT power
Cooling is the largest non-IT load
Better containment lowers cooling energy → lowers PUE
Even a 10% containment-efficiency improvement can meaningfully cut cooling energy, per airflow-management literature. Containment is among the cheapest PUE improvements available to an operating facility, because it requires sealing, not equipment replacement. The data-center PUE article (cluster sibling) quantifies the efficiency metric that containment directly feeds.
Per ASHRAE 90.4 and The Green Grid: containment raises return and allowable supply temperatures, enables economizer hours, and cuts fan over-supply, lowering cooling energy and PUE. A roughly 10% containment gain meaningfully reduces cooling energy, among the cheapest efficiency measures available.
Worked Example: 910 of 1,000 CFM Contained at 91 Percent
Scenario: contained-row hot-aisle layout, one aisle. Total rack exhaust 1,000 CFM (1,699 m³/h). Effectively contained 910 CFM (1,546 m³/h).
Step 1. Containment efficiency:
Efficiency = (910 / 1,000) × 100 = 91.0%
Step 2. Estimated leakage:
Leakage = 100 − 91.0 = 9.0%
Step 3. Classification:
91.0% falls in 85–95% → RECOMMENDED
Step 4. What it means:
910 CFM of hot exhaust stays contained; 90 CFM (9%) leaks toward the cold side.
Within the recommended band: good separation, acceptable leakage.
Step 5. The leakage in airflow terms:
90 CFM (153 m³/h) of hot air recirculating or bypassing.
Trace to specific paths (aisle ends, cutouts, blanking gaps) to push efficiency higher.
Step 6. Metric equivalence:
1,546 / 1,699 × 100 = 91.0% — same percentage; the ratio is dimensionless
Step 7. Improvement path:
Seal the 90-CFM leakage: blanking panels, brush grommets, end-door check.
Re-measure; moving to 95%+ enters the HIGH band.
Step 8. Reliability check:
91% keeps most hot air contained, supporting rack inlets within the TC 9.9 envelope.
Verify actual top-of-rack inlet temperatures (efficiency is airflow, not temperature).
Step 9. Energy note:
91% supports a hotter return and higher supply temperature, aiding CRAC efficiency
and economizer hours. The remaining 9% leakage is the energy left on the table.
Step 10. Result:
91.0% containment (9% leakage), RECOMMENDED. Good separation.
Seal leakage paths to reach HIGH (95%+); verify rack-inlet temperatures directly.
Screening metric: pair with commissioning and measured inlet temperatures.
Cross-reference CRAC Sizing: this is the delivery that the sized capacity depends on. Cross-reference Redundancy: containment must hold during a unit failure too.
Marginal and Excellent Worked Examples
Marginal case (Example 2):
Step 1. Lower contained fraction:
Contained 760 CFM (1,291 m³/h), Total 1,000 CFM (1,699 m³/h)
Efficiency = (760 / 1,000) × 100 = 76.0%
Leakage    = 100 − 76.0 = 24.0%
Step 2. Classification:
76.0% falls in 70–85% → LOW / MARGINAL
Step 3. Interpretation:
24% of hot exhaust leaks: meaningful recirculation, cooling working harder than needed.
Hot spots likely at top-of-rack and row ends.
Improvement clearly worthwhile.
Step 4. The fix:
24% leakage is large: check for missing blanking panels, open aisle ends, unsealed cutouts.
Sealing can move this well into the recommended band cheaply.
Excellent case (Example 3):
Step 5. Near-ideal:
Contained 992 CFM (1,686 m³/h), Total 1,000 CFM (1,699 m³/h)
Efficiency = (992 / 1,000) × 100 = 99.2%
Leakage    = 100 − 99.2 = 0.8%
Step 6. Classification:
99.2% falls above 98% → EXCELLENT
Step 7. Interpretation:
Only 0.8% leakage: near-perfect separation, minimal recirculation.
Result of disciplined sealing (blanking panels, grommets, sealed ends, complete panels).
Step 8. Diminishing returns:
From 99.2% there is little left to gain (0.8% leakage). Effort is better spent elsewhere.
Step 9. The contrast:
76% (marginal) vs 91% (recommended) vs 99.2% (excellent): same 1,000 CFM exhaust,
three sealing states. The difference is entirely leakage-path control.
Step 10. Summary:
76% marginal (24% leakage, seal aggressively).
91% recommended (9% leakage, target met).
99.2% excellent (0.8% leakage, near-ideal).
Containment quality is a sealing discipline, measured before and after.
Per airflow practice: 76% is low/marginal (24% leakage, seal aggressively); 99.2% is excellent (0.8% leakage, near-ideal). Same exhaust, different sealing discipline.
Application Boundaries: CFD, Rack Inlets, Measurement, Underfloor Bypass
This calculator applies to airflow-ratio containment efficiency (contained / total exhaust) for screening and operational review of a single aisle or containment zone. The following require separate analysis.
Rack-inlet temperature. Efficiency is an airflow ratio, not a temperature. It indicates separation quality but does not measure the actual rack inlet temperatures that govern TC 9.9 compliance. Measure inlets directly.
CFD and transient airflow. No computational fluid dynamics or transient behavior. Detailed airflow patterns, hot-spot locations, and dynamic response need CFD.
Leakage-path breakdown. Gives total leakage, not which path dominates. A field survey (thermal imaging, boundary airflow measurement) locates specific gaps.
Underfloor bypass. For raised-floor cooling, underfloor leakage and tile placement (bypass) are a separate metric. Cross-reference the Raised Floor Pressure Drop Calculator.
Measurement accuracy. Depends on accurate airflow measurement of both values at the same load state. Measurement error propagates directly to the efficiency percentage.
Return-air routing. Does not verify that the contained exhaust actually reaches the cooling unit intakes via ducting or plenum path.
Rack load distribution. Assumes the entered airflows represent the operating condition. Uneven rack loads shift where recirculation concentrates.
Cooling capacity and redundancy. A separate question handled by the cluster siblings. Good containment with insufficient capacity still overheats.
RCI/RTI indices. The Green Grid's rack cooling index and return temperature index are related but distinct metrics; this calculator provides a simpler airflow ratio.
Commissioning. A screening tool, not a commissioning report. Formal acceptance requires measured inlets, airflow diagnostics, and project criteria per TC 9.9.
Per ASHRAE TC 9.9 and The Green Grid: airflow-ratio containment efficiency is the calculator scope. Rack-inlet temperature, CFD, leakage-path location, underfloor bypass, measurement accuracy, return routing, capacity/redundancy, and RCI/RTI need separate analysis. A qualified engineer and commissioning verify final performance.
Hot Aisle Containment Efficiency Calculator
Open Hot Aisle Containment Efficiency Calculator
Hot aisle containment efficiency by the airflow ratio: divides the effectively contained hot aisle airflow by the total rack exhaust airflow to give the containment efficiency percentage, with the remainder as estimated leakage, then classifies the result from too low to excellent. It screens how well a containment system separates hot exhaust from the cold supply — the delivery step that sized cooling capacity depends on. The recommended band is 85 to 95 percent. Because it is an airflow ratio, not a temperature, pair it with measured rack inlet temperatures and commissioning per ASHRAE TC 9.9.
Open Hot Aisle Containment Efficiency CalculatorFAQ
What is hot aisle containment efficiency?
Per airflow-management practice: the fraction of rack hot exhaust that stays in the contained return path, expressed as contained airflow over total exhaust times 100. The remainder is estimated leakage that recirculates to the cold side or bypasses the load. It is a separation-quality metric, not a temperature reading, and applies equally in CFM or m³/h because the ratio is dimensionless.
What containment efficiency should I target?
Per practice: 85 to 95% is the recommended band for typical contained aisles, 95 to 98% is high, and above 98% is excellent. Below 85% invites recirculation and hot spots. The target balances sealing effort against diminishing returns at the high end; above 95% is achievable with disciplined blanking-panel, grommet, and end-door discipline.
What is the difference between recirculation and bypass?
Per The Green Grid: recirculation is hot exhaust leaking back to the cold side, raising rack inlet temperatures (a reliability failure); bypass is cold supply escaping to the return without cooling any load, wasting fan and cooling energy (an efficiency failure). Both lower containment efficiency, but they affect the system differently and the fixes target different paths.
What is the cheapest way to improve containment?
Per Upsite Technologies and practice: blanking panels in empty rack U-positions, brush grommets on cable cutouts, and closed aisle-end doors. These seal the biggest recirculation paths for a few dollars each, often moving a room from the marginal band into the recommended band without any cooling-plant changes.
Does high containment efficiency guarantee safe rack inlet temperatures?
Per ASHRAE TC 9.9: not by itself. Efficiency is an airflow ratio, not a temperature. It supports safe inlets by limiting recirculation, but the actual rack inlet temperature must be measured against the recommended envelope of 18 to 27°C (64 to 81°F). Verify inlets directly with calibrated sensors, especially at the top of high-density racks.
How does containment lower energy use?
Per ASHRAE 90.4 and The Green Grid: containment raises return air temperature (bigger ΔT, more efficient cooling), allows the supply temperature to be raised within the TC 9.9 envelope, enables more economizer hours, and cuts the fan over-supply needed to fight recirculation. Together these lower the cooling share of PUE, often for the cost of sealing materials alone.
Is this calculator a commissioning report?
Per practice: no. It is a screening metric computed from two airflow values. Commissioning adds measured rack inlet temperatures, leakage-path diagnostics, CFD analysis if needed, and project-specific acceptance criteria per ASHRAE TC 9.9. Use the calculator to screen and prioritize; use commissioning to verify final performance.
Related Calculators
- CRAC Unit Sizing Calculator: The cooling capacity whose delivery to the racks this containment efficiency governs (article).
- Data Center CRAC Redundancy Calculator: Single-failure cooling survivability; containment must hold during a unit failure (article).
- Server Rack Heat Load Calculator: Per-rack heat and airflow that the containment separates.
- Raised Floor Pressure Drop Calculator: Underfloor supply distribution and bypass, the supply-side airflow counterpart.
- Liquid Cooling Flow Rate Calculator: Direct-to-chip cooling for high-density racks beyond air containment.
- Cooling Load Calculator: General space cooling load.
- Fan Power Calculator: Fan power for the airflow the containment manages.
- Air Changes Per Hour Calculator: Room air changes for the IT space.
Standards References
- ASHRAE TC 9.9, Thermal Guidelines for Data Processing Environments, 5th ed. (2021). Defines the recommended rack-inlet envelope (18–27°C, 64–81°F), allowable A1–A4 classes, and containment guidance for hot-aisle/cold-aisle configurations.
- ASHRAE Standard 90.4-2019, Energy Standard for Data Centers. Covers supply-temperature raises enabled by containment, economizer requirements, and the energy implications of airflow management.
- ASHRAE Handbook of Fundamentals, Chapter 4 (Heat Transfer). Mass-airflow and temperature-rise relationships underlying containment efficiency and recirculation penalty analysis.
- The Green Grid, Airflow Management in the Data Center (White Paper No. 44, 2012). Defines recirculation versus bypass failure modes, Return Temperature Index (RTI), and Rack Cooling Index (RCI) as complements to containment efficiency screening.
- The Green Grid, Containment and Airflow Management Best Practices (2014). Containment efficiency metric, recommended efficiency bands, and leakage-path identification methods.
- Uptime Institute, Airflow Management Cascade (2012). Prioritized sequence for airflow-management improvements, identifying blanking panels and containment as the highest-return measures before chiller and cooling plant changes.
- Upsite Technologies, The Blanking Panel White Paper (2016). Quantified recirculation through open rack U-positions and the containment-efficiency gain from blanking-panel installation; grille-type and solid-panel comparisons.
- Vertiv, Data Center Airflow Management Best Practices (Application Note, 2019). Hot-aisle containment design, leakage-path assessment, thermal-imaging diagnostics, and containment efficiency measurement methodology.