Why a Duct Is the Only Part of an HVAC System Measured in Logarithms
Every other quantity travelling along a duct adds the way arithmetic suggests. Two branches carrying 500 and 300 L/s (1060 and 636 cfm) deliver 800 L/s (1696 cfm) where they meet. Pressure drops accumulate section by section, 40 Pa here and 25 Pa there (0.16 and 0.10 in w.g.) making 65 Pa (0.26 in w.g.). Heat gained through the duct wall over one run adds to the heat gained over the next.
Sound refuses to behave that way. Two identical sources at 50 dB each produce 53 dB rather than 100, because a decibel is the logarithm of a power ratio and it is the powers underneath that combine, not the numbers printed on the drawing. The quantity is logarithmic, frequency dependent, and additive only through energy, which puts it in a different class from everything else a duct carries.
The same property runs the other way along the path. Attenuation subtracts cleanly for as long as nothing between the two points returns sound energy to the airstream, so removing 20 dB from a 78 dB inlet leaves 58 dB and that step is honest arithmetic. The moment an element along the path becomes a source in its own right, subtraction stops describing the physics, and the difficulty is that nothing in the arithmetic announces the change.
The calculator multiplies an attenuation rate by a length, adds a fitting allowance for elbows, and subtracts the total from an inlet level. Within its stated scope that arithmetic is correct, and the page says plainly that the single rate stands in for a whole spectrum. This article covers what sits behind that statement: how far apart the octave bands actually are, which of them the fan fills, at what velocity a silencer starts making more noise than it removes, and why a result that looks conservative can be optimistic. The number comes out the same whether the assumptions hold or not, which is exactly why the assumptions are worth pricing.
Calculator Inputs: Four Numbers and What Each One Hides
Four numbers, a unit toggle, and a spectrum compressed into each of them.
Unit System. Imperial (ft, dB/ft) or Metric (m, dB/m). Decibels are dimensionless and carry across unchanged.
Inlet Sound Level [dB]. The level arriving at the start of the section, taken from fan data and whatever path precedes it. Fan sound power at the discharge of a commercial air handling unit commonly sits between 70 and 95 dB depending on duty and wheel type.
Duct Length [ft or m]. The length of the straight run being treated, typically 3 to 15 m (10 to 50 ft) between the plant and the first branch.
Straight Duct Attenuation Rate [dB/ft or dB/m]. The effective attenuation per unit length. The page ranges are 0.2 to 1.5 dB/ft (0.7 to 5.0 dB/m) for lined duct and 0.02 to 0.2 dB/ft (0.07 to 0.66 dB/m) for unlined duct.
Number of Elbows and Elbow Attenuation [dB per elbow]. Both optional. The allowance is 1 to 6 dB per elbow depending on size and whether the elbow is lined.
Outputs are the straight duct attenuation, the elbow attenuation, the total, and the level leaving the section.
What each field compresses:
Inlet Sound Level: one number in place of six or eight octave bands,
  and the fan sounds different in every one of them.
Attenuation Rate: one number in place of the same curve, and the two
  curves run opposite ways, attenuation rising with frequency while
  the fan spectrum falls.
Elbow Attenuation: a figure that for a lined elbow at mid frequencies
  reaches 6 dB and at 63 Hz is close to nothing.
Duct Length: the only field with no frequency dependence at all.
What is not among the fields:
Air velocity, which governs the noise the fittings generate themselves.
Duct size, which governs both the attenuation per unit length and the
  reflection at the outlet.
The shape of the source spectrum.
Any path other than the inside of the duct.
The absence of velocity is the defining feature of the model, and the section on regenerated noise below shows what follows from it.
One Number Cannot Represent a Spectrum
Duct attenuation is not a single value with modest scatter around it. It varies across the audible range by more than an order of magnitude, and the one rate the model accepts is a weighted guess at which part of that range matters.
How lining behaves across the range, as an order of magnitude for a medium rectangular duct with 25 mm (1 in) lining:
   63 Hz    a fraction of a decibel per metre
  125 Hz    a few tenths
  250 Hz    on the order of one
  500 Hz    several
    1 kHz   the peak, several
    2 kHz   comparable with the peak or a little below
The reason sits in the wavelength rather than in the material:
Lining absorbs well when the wavelength is small compared with the
  thickness of the layer and the size of the cross section.
At 63 Hz the wavelength is 5.4 m (17.7 ft), far larger than any duct,
  and the sound passes almost unimpeded.
At 1 kHz it is 0.34 m (13 in), comparable with the cross section,
  and absorption works at full strength.
What that does to a broadband result:
A single figure of 24 dB can stand for 3 dB at 63 Hz and 40 dB at 1 kHz.
The fan is loudest in exactly the band where the 3 dB applies.
The subtraction is right on average and wrong where the problem lives.
Design work therefore runs band by band, from 63 Hz to 8 kHz, and produces a spectrum rather than a number. That spectrum is compared with a room criterion curve, and one band usually settles the comparison, most often 125 or 250 Hz.
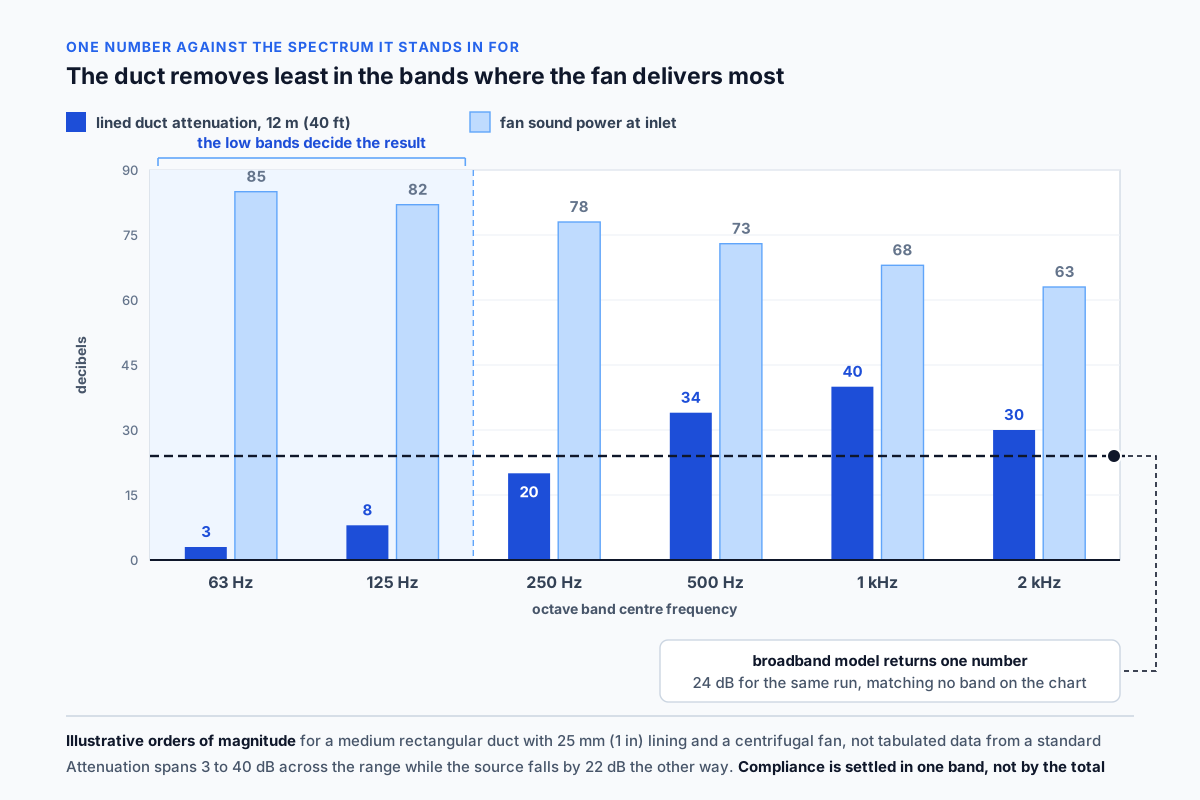
Per ASHRAE Handbook, HVAC Applications (2023), Chapter 49: duct attenuation data is tabulated octave band by octave band because the variation across the audible range exceeds an order of magnitude, and design compliance is normally decided by a single band rather than by a broadband figure.
The Fan Spectrum Decides Which Band Matters
The source is no flatter than the duct. The shape of the fan spectrum decides which bands the design has to survive, and it leans the wrong way.
Centrifugal fans put most of their sound power into the low bands,
  63 and 125 Hz, falling away towards the top of the range.
Axial fans sit higher and carry a pronounced component at the
  frequency at which the blades pass a fixed point.
That component has a fixed address in the spectrum:
f = n × N / 60

f = blade pass frequency, Hz (typically 100 to 600 Hz)
n = rotational speed, rpm (600 to 1800 for commercial fans)
N = number of blades (8 to 16 for a centrifugal wheel)

A wheel at 900 rpm with 12 blades gives 180 Hz, which falls at the
boundary between the 125 Hz band, roughly 88 to 177 Hz, and the
250 Hz band, roughly 177 to 355 Hz.
Why the low bands decide:
The source spectrum rises towards low frequency and the attenuation
  of the path falls towards low frequency. The two unfavourable
  conditions coincide.
Above a kilohertz the opposite holds: the source is quieter and the
  path absorbs well, and those bands almost never govern.
The design problem reduces to the bottom of the range, where lining contributes little and only four things help: length, reflection at the outlet, division of power into branches, and purpose-built low-frequency silencers with resonant chambers. Fan selection sits above all of them, because moving the operating point along the curve changes both the level and the shape of the spectrum, and a fan running well away from its best efficiency point delivers noticeably more low-frequency content, which is the content the path removes least well.
Per ASHRAE Chapter 49 and fan manufacturer sound data: centrifugal fans radiate most of their sound power in the low octave bands where duct attenuation is weakest, so compliance is normally decided in the 63 to 250 Hz range rather than by the broadband total.
Where Subtraction Stops Working: Regenerated Noise
Every element that removes sound also creates it. Air forced through a restriction sheds turbulence, turbulence radiates sound, and past a certain velocity the element is a louder source than the noise it was installed to remove.
Air passing the contraction of a silencer, the edge of an elbow, or
  the blade of a damper generates turbulence, and turbulence radiates.
The level rises very steeply with velocity, on the order of the fifth
  or sixth power, so a doubling of velocity adds roughly 15 to 18 dB.
The model cannot see any of this, because velocity is not among its inputs. It subtracts an attenuation from an inlet level without knowing that the element providing the attenuation is radiating at the same time.
What high velocity does to a real selection:
A silencer with 20 dB insertion loss in a duct at about 10 m/s
  (2000 fpm) face velocity may regenerate a little over 40 dB.
The same unit at 15 m/s (3000 fpm) regenerates roughly ten decibels
  higher.
If 45 dB remains after the insertion loss is subtracted and the unit
  itself generates 50 dB, the outcome is about 51 dB rather than 45.
The result is set by what the silencer added, not by what it removed.
The threshold is worth carrying as a rule:
While the regenerated level sits 10 dB or more below the level passing
  through, its contribution is under half a decibel and can be ignored.
When the two are equal, the contribution is a full 3 dB.
When the regenerated level is higher, it governs the result completely.
Face velocity in a silencer is therefore chosen from the noise target rather than from the pressure available. For sensitive spaces the practical ceiling sits near 8 to 10 m/s (1600 to 2000 fpm) in the free area, and that limit is what rules out compact units with small free area on quiet projects.
Per ASHRAE Chapter 49 and ASTM E477: silencers and fittings regenerate noise that rises steeply with velocity, and when the regenerated level approaches the level passing through, the element determines the result regardless of its insertion loss.
End Reflection Helps Exactly Where Lining Does Not
Where the duct opens into the room, part of the low-frequency sound turns round and travels back up the duct instead of radiating out. The mechanism works precisely in the bands where lining fails.
A wave reaching the end of the duct meets an abrupt change in acoustic
  impedance. Part of the energy radiates into the room and part reflects.
The reflected fraction grows as the wavelength grows relative to the
  size of the opening.
Orders of magnitude for a terminal opening around 300 mm (12 in):
   63 Hz    substantial, on the order of ten decibels
  125 Hz    noticeable, a few decibels
  250 Hz    small
  500 Hz    effectively absent
Above a kilohertz the mechanism does nothing at all.
This is the only mechanism along the path that delivers meaningful attenuation at 63 Hz. Lining is useless there, elbows give little, and without end reflection the bottom band would arrive at the room untreated.
What weakens it:
A large opening reflects less than a small one.
A gradual transition into the grille softens the impedance step and
  takes the reflection with it.
Several small outlets rather than one large one perform better at low
  frequency for the same total free area.
End reflection is named on the calculator page among the effects the model does not compute. For a broadband screen that omission is conservative, since the mechanism only ever helps.
Per ASHRAE Chapter 49: end reflection returns a portion of low-frequency energy back into the duct at the terminal opening, providing attenuation in the bands where lining is least effective, with the effect diminishing as the opening grows and vanishing above roughly 500 Hz.
Breakout Bypasses the Duct Entirely
Sound does not only travel to the outlet. It passes through the duct wall along the way, and a long lined run can deliver a quiet outlet while filling the ceiling void with the noise it removed.
The duct wall vibrates under the internal sound field and radiates
  into the space around it.
Through a suspended ceiling that sound reaches the room directly,
  skipping the whole remaining length of the path.
Where it turns critical:
The section between the fan and the first silencer, wherever it runs
  above an occupied space.
Rectangular ducts, with large flat panels of low stiffness, radiate
  substantially more than round ducts of equivalent capacity.
Low frequencies pass through the wall more readily than high ones,
  which puts the problem in the same bands as everything else here.
Treating the airway does not help, and this is the part that surprises. Lining reduces the level reaching the outlet, but the section upstream of the lining still radiates the full internal level through its wall. Extending the treated run improves the outlet and changes nothing about what escapes before it.
Round cross section instead of rectangular over occupied spaces.
External lagging with a dense limp membrane, working as added mass.
The first silencer moved close to the fan, so that the length of duct
  carrying the full internal level is as short as possible.
The path also runs backwards, with noise from a plant room entering the duct through its wall and continuing along the system to other spaces.
Per ASHRAE Chapter 49 and SMACNA HVAC Duct Construction Standards: duct wall breakout transmits low-frequency sound into surrounding spaces independently of the attenuation achieved along the airway, and rectangular ducts radiate substantially more than round ones of equivalent capacity.
Branch Splits Divide Power, Not Level
When a duct divides, the sound power divides with the airflow, and the resulting drop in level follows a logarithm rather than a proportion.
A_branch = 10 × log10(A_b / A_t)

A_branch = attenuation into the branch, dB (typically 3 to 12 dB)
A_b      = area of the branch, m² or ft² (0.02 to 1.0 m²)
A_t      = total area downstream of the split, m² or ft²
What the relation gives:
An even split into two:        10 × log10(0.5)  = −3.0 dB
A quarter into the branch:     10 × log10(0.25) = −6.0 dB
A tenth into the branch:       10 × log10(0.1)  = −10.0 dB
Two features make this valuable. The mechanism has no frequency dependence worth speaking of, so it works equally in every band including the low ones where lining is helpless, and it costs nothing, since the geometry is already there for airflow reasons. A branched system with many outlets collects substantial attenuation simply by being branched.
The consequence for design is that the outlet nearest the fan takes the smallest division and is normally the critical one. Calculations follow the worst path rather than an average of the paths.
Branch division is listed on the calculator page among the effects outside the model. For a single straight section that omission changes nothing, and for a distributed system it removes one of the main mechanisms.
Per ASHRAE Chapter 49: sound power divides at a branch in proportion to the area split, giving a level reduction of ten times the logarithm of the fraction, and unlike lining this mechanism works equally in every octave band.
Adding Levels Requires Energy, Not Arithmetic
Wherever two sound paths meet, their levels combine through their energies, and the rule that follows is counterintuitive enough to be worth stating outright.
L_total = 10 × log10(10^(L1/10) + 10^(L2/10))

L_total = combined level, dB
L1, L2  = the two contributing levels, dB (20 to 100 dB in duct work)
What it delivers:
Difference between sources    Added to the higher
        0 dB                        3.0 dB
        3 dB                        1.8 dB
        6 dB                        1.0 dB
       10 dB                        0.4 dB
       15 dB                        0.1 dB
Two identical sources give three decibels more than one rather than twice the level. A source ten decibels below its neighbour lifts the total by less than half a decibel and can be left out of the account entirely.
Where this appears along a duct:
Duct-borne noise combining with breakout through the wall.
The level passing through an element combining with the noise that
  element regenerates.
The contributions of several outlets serving one room.
Subtraction is the simpler operation for a good reason. Attenuation acts on one stream of energy and reduces it, so the levels subtract directly. Two independent streams have to be taken back to energies before they can be put together, and the model on the page works only with the first case.
The ten decibel gap is the practical threshold throughout this work. It decides when a second path can be ignored, and it is the same threshold that decides when regenerated noise stops being a footnote and starts being the answer.
Per ASHRAE Handbook, Fundamentals (2025), Chapter 8: sound levels combine logarithmically through their energies, so two equal sources give three decibels more than one, and a contribution ten decibels below another raises the total by less than half a decibel.
From Sound Power to What a Room Criterion Measures
The number leaving the duct is not the number a criterion refers to. A criterion describes sound pressure in a room, and the calculation delivers sound power at an outlet. They share a unit and measure different things.
Sound power characterises the source and does not depend on the room.
Sound pressure depends on distance, room absorption, the number of
  outlets, and where the listener stands.
Room criteria are written in terms of pressure.
The conversion between them needs the room:
Room volume and total absorption.
Distance from the outlet to the point being assessed.
The number of outlets contributing to that point.
The procedure is set out in AHRI Standard 885, written specifically
  to estimate the level in the occupied space.
The criteria themselves are not single numbers either. NC and RC are sets of limits, one per octave band, and compliance is settled by the worst band, normally somewhere low in the range. A room can meet its criterion in five bands out of eight and fail in the sixth, and a broadband figure shows nothing of that.
A broadband result therefore cannot answer the compliance question, because it is tied neither to a spectrum nor to a room. Its value coinciding with the number in a criterion means nothing at all, those being different quantities that happen to share a unit. What it is good for is comparing options against each other and establishing the order of treatment a system needs. Once the estimate comes close to the criterion, the work moves to an octave band calculation following AHRI 885 with manufacturer data.
Per AHRI Standard 885 (2008) and ASHRAE Chapter 49: room noise criteria are defined as octave band limits on sound pressure in the occupied space, while duct calculations deliver sound power at an outlet, and the conversion requires room absorption, distance, and the number of contributing outlets.
Lining Costs Pressure and Pressure Costs Fan Noise
Acoustic treatment is not free inside the airway. It adds resistance, resistance demands fan pressure, and fan pressure produces sound power, which returns part of the problem to the source that created it.
Lining reduces the free area and raises the surface roughness.
A silencer adds resistance, commonly 25 to 125 Pa (0.10 to 0.50 in w.g.)
  depending on type and velocity.
Total system resistance rises and the fan is selected for more pressure.
Fan sound power rises with both flow and pressure.
The scaling is steep enough to matter:
Fan sound power grows roughly as ten logarithms of flow plus twenty
  logarithms of pressure, so doubling the pressure at unchanged flow
  lifts the level by about 6 dB.
A high-resistance silencer therefore hands back part of what it gained, through a louder source feeding the same duct. A compact unit with small free area loses twice over, once on resistance and once on the regenerated noise that comes with the velocity through that small area.
The response is to run the aerodynamic and acoustic calculations together rather than one after the other. Choosing a larger cross section at lower velocity improves both sides at once, which is unusual enough in engineering to be worth taking when it appears.
The effect of acoustic treatment on pressure loss is listed on the calculator page among the things the model does not address.
Per ASHRAE Chapter 49 and fan sound power relations: acoustic treatment adds airway resistance, which raises the fan pressure required and with it the fan sound power, returning part of the attenuation gained to the source.
Worked Example: 78 dB In, 50 dB Out, and What the Number Omits
The scenario matches the imperial example on the calculator page.
Inlet sound level        78 dB
Straight duct length     40 ft (12.2 m)
Attenuation rate         0.6 dB/ft (1.97 dB/m)
Elbows                   2 at 2 dB each
Step 1. Straight duct attenuation.
A_straight = 0.6 × 40 = 24 dB
Step 2. Elbow attenuation.
A_elbows = 2 × 2 = 4 dB
Step 3. Total attenuation.
A_total = 24 + 4 = 28 dB
Step 4. Level leaving the section.
L_out = 78 − 28 = 50 dB
Step 5. Where the result lands on the page scale. A total of 28 dB falls in the 15 to 30 dB band, which the page reads as high attenuation, a strong practical reduction for a single section.
Step 6. What the rate of 0.6 dB/ft stands for. It sits in the upper half of the lined duct range and suits a medium cross section. Being an effective value standing in for a curve, it behaves more like the mid-frequency part of that curve than the low-frequency part.
Step 7. The first omission. At 63 Hz the same run delivers a small fraction of 24 dB, and that is the band in which the fan is loudest. A broadband outlet level of 50 dB does not mean 50 dB in every band, and the band that decides compliance is the one where the treatment did least.
Step 8. The second omission. No velocity was given. If the section contains a silencer or a damper and the velocity exceeds roughly 10 m/s (2000 fpm), the noise that element generates may be comparable with the calculated 50 dB and may set the result on its own.
Step 9. The third omission. Breakout through the wall of the untreated section upstream, division of power into branches downstream, and end reflection at the terminal opening. The first makes the outcome worse and the other two make it better, and none of the three appears in the 50 dB.
Step 10. What to do with the 50 dB. Use it to size the order of treatment required and to compare one arrangement against another. Do not use it as a room level or as evidence of compliance with a criterion. Once the estimate approaches the criterion, move to an octave band calculation with tested component data.
The metric example on the page, 12 m at 2.0 dB/m, produces the same 24 dB and the same 50 dB outlet. As the page notes, the two sets of inputs are convenient round values rather than exact conversions of one another.
The Same Run Read Band by Band
Running the same duct as a spectrum rather than as a single number changes which part of the problem looks difficult. The figures below are orders of magnitude that illustrate the shape of the dependence, not tabulated values.
For a lined run of 12 m (40 ft) in a medium cross section:
   63 Hz    a few decibels
  125 Hz    on the order of ten
  250 Hz    several tens
  500 Hz    several tens
    1 kHz   several tens
The broadband figure of 24 dB matches none of these.
The source runs the other way:
The spectrum of a centrifugal fan falls from low frequency to high,
and the gap between the bottom band and the top is commonly fifteen
decibels or more.
Put the two together and the outcome follows:
The bands where the source is loud are treated weakly.
The bands where the treatment is strong hold a quiet source already.
The spectrum leaving the run is markedly more low frequency than the
  spectrum that entered it.
That is audible, and it is why the complaint has a characteristic form. What remains is low-frequency energy heard as a rumble, passing through construction and hard to localise, which is the description that arrives from occupants after a system is commissioned rather than during design. A broadband figure gives no warning of it, because the shift towards the low bands happens inside the average and leaves the total looking healthy.
The low bands respond to a short list of measures:
More treated length, since a small attenuation per metre is compensated
  by the number of metres.
End reflection, exploited by choosing smaller outlets.
Silencers with resonant chambers tuned to the low bands.
A reconsidered fan selection and operating point.
Per ASHRAE Chapter 49: because duct attenuation rises with frequency while fan sound power falls, the spectrum leaving a treated run is weighted towards the low bands, which is why residual duct noise is typically perceived as a low-frequency rumble.
Application Boundaries: Octave Analysis, Room Criteria, Tested Data
The model covers broadband attenuation along one duct section in which nothing adds sound. Everything below needs separate treatment.
Octave analysis. The model returns one number where compliance is settled in one band, usually a low one, and the relation between the two is not fixed.
Regenerated noise. Velocity is not an input, while the noise generated by elements rises very steeply with it, so at high velocity the result belongs to the element rather than to the subtraction.
End reflection. Not included, and it works in favour of the calculation by adding attenuation at low frequency, on the order of ten decibels at 63 Hz for a 300 mm (12 in) opening.
Breakout. The path around the airway is not considered and can govern where a long untreated section runs above an occupied space.
Branch division. Not included, and for a distributed system it supplies substantial attenuation with no frequency dependence, 3 dB at an even split and 10 dB into a tenth.
Fan spectrum. The inlet level is one number, while the shape of the spectrum decides which band turns out to be critical.
Room criteria. The calculation yields a quantity at the outlet and criteria refer to pressure in the room, and the step between them needs room absorption, distance, and the number of contributing outlets.
Pressure loss. The effect of acoustic treatment on system resistance, and through it on fan sound power, is outside the model.
Manufacturer data. Final selection of silencers and lining follows tested performance by band rather than generalised rates.
Per ASHRAE Handbook, HVAC Applications (2023), Chapter 49 and AHRI Standard 885 (2008): broadband attenuation along a single duct section is the scope of this model, while octave band analysis, regenerated noise, end reflection, breakout, branch division, room criteria, and tested component data require separate treatment.
Sound Attenuation in Ducts Calculator
Duct sound attenuation by a broadband screening model: it multiplies an effective attenuation rate by the duct length, adds a fitting allowance for elbows, and subtracts the total from the inlet sound level to estimate the level leaving the section. The single rate stands in for a spectrum that varies by more than an order of magnitude across the audible range, and the subtraction assumes nothing along the path adds sound energy back. A first-pass comparison tool, not an octave band analysis or a room criterion check.
Open Sound Attenuation in Ducts CalculatorStandards and References
- ASHRAE Handbook, HVAC Applications (2023), Chapter 49, Noise and Vibration Control. The octave band procedure for a duct system, attenuation data for duct elements, regenerated noise, end reflection, breakout through the duct wall, and division of sound power at branches.
- ASHRAE Handbook, Fundamentals (2025), Chapter 8, Sound and Vibration. Fundamentals of the decibel, logarithmic addition of levels, frequency bands, and weighting.
- AHRI Standard 885 (2008, with subsequent addenda), Procedure for Estimating Occupied Space Sound Levels in the Application of Air Terminals and Air Outlets. The step from sound power at an outlet to sound pressure in the occupied space.
- ASTM E477, Standard Test Method for Laboratory Measurements of Acoustical and Airflow Performance of Duct Liner Materials and Prefabricated Silencers. Laboratory measurement of insertion loss, self-generated noise, and airflow resistance.
- ISO 7235, Acoustics: Laboratory Measurement Procedures for Ducted Silencers and Air-Terminal Units. The international procedure for silencer testing.
- ISO 3741 and ISO 3744, Determination of Sound Power Levels of Noise Sources. Reverberation room and free-field methods behind published fan sound power data.
- ANSI/ASA S12.60, Acoustical Performance Criteria, Design Requirements, and Guidelines for Schools. A worked example of a regulated criterion expressed band by band.
- SMACNA HVAC Duct Construction Standards, Metal and Flexible. Duct construction, gauge and reinforcement, which govern how much a duct wall radiates.
- Manufacturer test data for silencers and duct liner. Insertion loss by octave band and self-generated noise as a function of face velocity, measured to ASTM E477 or ISO 7235.
FAQ
Why is duct attenuation calculated octave band by octave band?
Per ASHRAE Handbook, HVAC Applications (2023), Chapter 49: because attenuation varies across the audible range by more than an order of magnitude. Lining absorbs strongly around a kilohertz, where the wavelength of 0.34 m (13 in) is comparable with the duct, and very weakly at 63 Hz, where the wavelength of 5.4 m (17.7 ft) is far larger than any duct. A single broadband figure averages that away, and compliance is normally decided by one band.
Which octave band usually decides the design?
Per ASHRAE Chapter 49: one of the low bands, commonly 125 or 250 Hz. Centrifugal fan sound power is highest there while duct attenuation is weakest, so the two unfavourable conditions coincide in the same part of the spectrum. The upper bands rarely govern, because the source is already quiet there and the treatment works at full strength.
Can a silencer make a duct louder?
Per ASHRAE Chapter 49 and ASTM E477: yes, above a certain velocity. Air passing through the restriction generates turbulence, and the regenerated level rises roughly as the fifth or sixth power of velocity, so a doubling of face velocity adds on the order of 15 to 18 dB. Once the regenerated level approaches the level passing through, the silencer sets the result regardless of its insertion loss.
How do two sound levels add?
Per ASHRAE Handbook, Fundamentals (2025), Chapter 8: through their energies, as ten times the logarithm of the sum of the antilogarithms. Two equal sources give three decibels more than one rather than twice the level, and a source ten decibels below another adds less than half a decibel to the total, which is the practical threshold for ignoring a contribution.
What is end reflection and why does it matter?
Per ASHRAE Chapter 49: part of the low-frequency energy reflects back into the duct at the terminal opening rather than radiating into the room, because the wavelength is large compared with the opening. It is the one mechanism giving useful attenuation at 63 Hz, where lining is ineffective, and it weakens as the opening grows, vanishing above roughly 500 Hz.
Does a quiet calculated outlet level mean a quiet room?
Per AHRI Standard 885 (2008): no. The duct calculation delivers sound power at an outlet while a room criterion describes sound pressure in the occupied space, and the conversion requires room absorption, the distance to the listener, and the number of outlets contributing to that point. Breakout through the duct wall can also bypass the airway entirely.
When is a broadband estimate sufficient?
Per ASHRAE Chapter 49: when comparing options against one another or establishing the order of treatment required, and when the result sits well clear of the criterion. Once it comes close, the octave band procedure with tested component data is the only way to know which band governs and whether any element along the path is adding sound of its own.
Related Calculators
- Duct Friction Loss Calculator: The resistance of the run, which rises as soon as acoustic treatment is added and which sets the pressure the fan has to produce.
- Duct Velocity Calculator: The velocity in the cross section, the quantity that governs how much noise elements along the path generate for themselves.
- Duct Size Calculator: The cross section, which acts on attenuation per unit length, on velocity, and on reflection at the outlet at the same time.
- Duct Pressure Drop Calculator: Total pressure loss along the path with acoustic elements included in the count.
- Fan Power Calculator: Fan power, which climbs with the pressure demanded and carries sound power up with it.
- Fan Law Calculator: The change of operating point, which alters both the level and the shape of the source spectrum.
- Fan Efficiency Calculator: Distance from the best efficiency point, which strengthens the low-frequency content the path removes least well.
- Air Velocity Calculator: Velocity through the free area of silencers and fittings, against the 8 to 10 m/s (1600 to 2000 fpm) limit that applies to sensitive spaces.