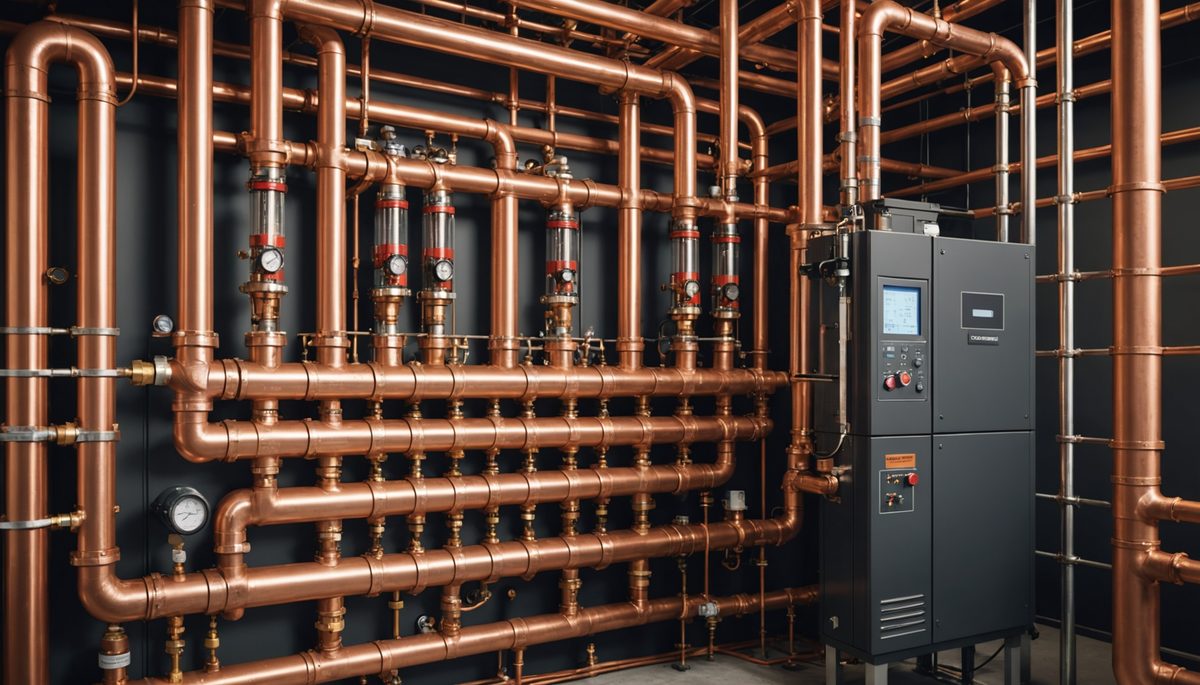
Why the Total Pump Flow Being Right Does Not Mean the Circuits Are
A hydronic system can have its pump delivering exactly the right total flow and still fail, because water is lazy: it takes the path of least resistance, so the near, low-resistance circuits pull more than their share while the far, high-resistance circuits are starved, and balancing is the act of forcing each circuit to take only its design flow.
Parallel circuits on a common pump share the available pressure. Flow through each depends on its resistance: a short, low-resistance circuit near the pump passes more flow than a long, high-resistance circuit at the end of the run, even though every circuit sees a similar pressure difference. The pump can push the correct total gallons per minute while distributing them wrongly, over-serving the easy circuits and under-serving the hard ones. The under-served terminals cannot deliver their rated heating or cooling, producing comfort complaints in the very zones the system appears to be serving.
The calculator checks a single circuit's balance by dividing its actual measured flow by its design flow, giving a flow ratio, and expresses the gap as a deviation percent, then classifies it against a commissioning tolerance band. It is the balancing-check step in the hydronic workflow. The Glycol Concentration article set the fluid, and the Liquid Cooling Flow Rate article sized the loop flow; this article ensures each circuit receives its share of that flow. A ratio of 1.00 is perfect; the recommended band is 0.95 to 1.05. Balancing is verified circuit by circuit against the design schedule, per TAB and commissioning practice.
Calculator Inputs: Actual Measured Flow and Design Flow
The calculator uses two flow inputs and classifies the result against the commissioning band.
Unit System. Imperial (GPM) or Metric (L/s). The flow ratio is dimensionless, so the calculation logic is identical in either unit; the choice sets how results are labeled.
Actual Flow Rate [GPM or L/s]. The measured flow currently in the circuit, from a calibrated instrument: an ultrasonic meter, orifice plate, or circuit setter with pressure taps. This value is measured, not estimated. Section 10 explains why valve position cannot substitute for a calibrated measurement.
Design Flow Rate [GPM or L/s]. The intended flow from the design schedule or equipment tag (coil or terminal data sheet). This is the balancing target. Both inputs must use the same unit:
Actual and design must use the same unit (both GPM or both L/s).
Mixing units gives a meaningless ratio.
Calculator outputs. Flow Ratio (actual/design, dimensionless), Flow Deviation (percent), status badge: TOO LOW, LOW-MARGINAL, RECOMMENDED, HIGH, or TOO HIGH. The core relations:
flow_ratio     = actual_flow / design_flow       [dimensionless]
flow_deviation = ((actual − design) / design) × 100   [%]
The check is per circuit:
Each terminal circuit has its own design flow from the design schedule.
Balance each against its own target, one circuit at a time.
What the calculator does not account for: valve authority, differential pressure, pump head or curve, actual heating or cooling capacity delivered, the physical cause of imbalance, multi-circuit hydraulic interaction, control-valve modulation, measurement instrument error, temperature or ΔT verification, glycol viscosity effect on flow measurement, or direct-versus-reverse-return topology. It is a balancing screen, not a TAB acceptance record.
The Flow Ratio and the Deviation Percent
The balance check is two simple numbers: the flow ratio, actual over design, and the deviation percent, how far off that is from the target.
Flow Ratio     = actual_flow / design_flow   [dimensionless]
Flow Deviation = ((actual − design) / design) × 100   [%]

Ratio 1.00 = perfect balance (actual equals design)
Deviation 0% = perfect balance
Worked (Imperial example):
Actual 9.2 GPM (0.580 L/s), Design 10.0 GPM (0.631 L/s)
Flow Ratio  = 9.2 / 10.0 = 0.92
Deviation   = ((9.2 − 10.0) / 10.0) × 100 = −8%
A ratio of 0.92 means the circuit delivers 92 percent of its design flow. A deviation of −8% means it is 8 percent below design, the negative sign indicating underflow.
Sign convention:
Ratio < 1.00 / negative deviation = UNDERFLOW (circuit starved)
Ratio > 1.00 / positive deviation = OVERFLOW (circuit over-served)
Ratio = 1.00 / 0%               = perfectly balanced
Dimensionless and unit-independent:
The ratio divides two flows in the same unit, so the unit cancels.
0.92 whether the inputs are GPM or L/s.
A 5 GPM circuit and a 50 GPM circuit both read balance as a ratio near 1.00.
Why ratio, not raw flow:
Raw flow is meaningless without the target: 20 GPM is fine if design is 20,
starved if design is 30, flooded if design is 10.
The ratio ties actual to the specific design intent for each circuit.
Per ASHRAE Handbook HVAC Systems and Equipment and TAB practice: balance is the flow ratio (actual/design, dimensionless) and the deviation percent. Ratio 1.00 is perfect; below is underflow, above is overflow. The ratio ties each circuit to its own design target, comparable across circuit sizes.
Flow Ratio versus Deviation: Two Views of the Same Gap
The flow ratio and the deviation percent describe the same gap from two angles, and knowing the arithmetic that links them avoids confusing the two.
The relationship:
Deviation (%) = (Flow Ratio − 1) × 100
Flow Ratio    = 1 + Deviation / 100
Examples:
Ratio 0.92 → deviation (0.92 − 1) × 100 = −8%
Ratio 1.05 → deviation (1.05 − 1) × 100 = +5%
Ratio 1.24 → deviation (1.24 − 1) × 100 = +24%
Why two numbers: the flow ratio is an absolute multiplier (0.92× design), intuitive for "how much of design is being delivered." The deviation percent is the signed gap (−8%), intuitive for "how far off and in which direction."
When each is clearer:
Ratio:     quick sense of delivery fraction (0.92 = 92% delivered)
Deviation: quick sense of correction size (−8% = need 8% more flow)
Do not confuse them:
Ratio 0.92 is NOT −92% or 92% deviation; its deviation is −8%.
Ratio is (actual / design); deviation is the percent change from design.
Both come from the same inputs: enter actual and design once, the calculator gives both. They always agree because deviation = (ratio − 1) × 100.
TAB reports often list both: the ratio for at-a-glance balance status, the deviation for the adjustment size needed. Per AABC National Standards and NEBB Procedural Standards: deviation equals (flow ratio − 1) × 100, two views of one gap. A 0.92 ratio has a −8% deviation, and a 1.05 ratio has a +5% deviation. Do not mistake the ratio for the deviation percent.
The Balancing Band and Its Interpretation Tiers
The calculator maps the flow ratio to five tiers, with a recommended band of 0.95 to 1.05: the ±5% tolerance standard hydronic commissioning accepts as balanced.
| Flow Ratio | Deviation | Status |
|---|---|---|
| Below 0.85 | Below −15% | TOO LOW |
| 0.85–0.95 | −15% to −5% | LOW / MARGINAL |
| 0.95–1.05 | −5% to +5% | RECOMMENDED |
| 1.05–1.15 | +5% to +15% | HIGH |
| Above 1.15 | Above +15% | TOO HIGH |
Tier by tier. Below 0.85: significant underflow; the terminal cannot deliver rated capacity; investigate differential pressure, valve position, or circuit resistance. The 0.85–0.95 range: slightly below design, limited margin, check the valve and available pressure. The recommended 0.95–1.05 range: within ±5% commissioning tolerance, accepted as balanced. The 1.05–1.15 range: above design, review whether intentional or correct it. Above 1.15: significant overflow; throttle to stop wasting pump energy and starving other circuits.
The ±5% tolerance:
0.95–1.05 reflects standard hydronic commissioning practice.
Perfect 1.00 is not required; within ±5% is accepted as balanced.
Project specs may differ:
Some project specifications tighten the acceptance band to ±3% strict,
or relax it to ±10% for lower-priority circuits.
The 0.95–1.05 band is the default; the project spec governs acceptance.
Underflow versus overflow asymmetry:
Underflow (starved terminal): directly loses capacity, comfort complaints.
Overflow: wastes pump energy AND starves other circuits (double harm).
Both fall outside the acceptable band; neither should be tolerated.
Per ASHRAE Handbook HVAC Systems and Equipment and commissioning practice: the recommended band is 0.95–1.05 (±5%), the standard hydronic commissioning tolerance. Below 0.85 is significant underflow (lost capacity); above 1.15 is overflow (wasted pump energy, starved neighbor circuits). Project specifications set the final acceptance criteria.
Flow Stealing: Why Low-Resistance Circuits Over-Flow
The reason balancing is necessary at all is flow stealing: on a shared pump, water distributes by resistance, so low-resistance circuits pull more than their design share and high-resistance circuits get less, regardless of whether the pump delivers the correct total flow.
The physics:
Parallel circuits share the pump's available differential pressure.
Flow through each is proportional to 1/√(resistance) at a given pressure.
Low resistance → high flow; high resistance → low flow.
Why near circuits steal:
Circuits near the pump have shorter pipe runs and lower resistance.
They pass more flow for the same available pressure.
Far circuits (longer runs, higher resistance) are left with less.
The total-is-right trap:
The pump can deliver the correct TOTAL flow.
But distribute it wrongly: near circuits over their design, far circuits under.
Sum is correct; distribution is wrong.
The consequence:
Far terminals starve, cannot deliver rated capacity, comfort complaints in far zones.
Near terminals over-flow, wasting pump energy; their excess is exactly
what is taken from the far circuits.
Direct versus reverse return:
Direct return: near circuits have shorter total path, steal more (worse imbalance).
Reverse return: equalizes total path lengths ("first in, last out"),
  reducing but not eliminating imbalance.
Even reverse-return systems typically need balancing valves.
Balancing corrects the distribution:
Add resistance to the low-resistance (over-flowing) circuits via balancing valves.
This raises their resistance to match the design distribution.
Every circuit then takes its design share.
A larger pump raises total flow but does not fix distribution. Near circuits still steal proportionally; balancing is about distribution, not quantity.
Per ASHRAE Fundamentals (Chapter on Fluid Flow) and ASHRAE Handbook HVAC Systems and Equipment: flow distributes by resistance, so low-resistance near circuits over-flow and high-resistance far circuits starve, even at the correct total flow. Balancing valves add resistance to the over-flowing circuits, restoring the design distribution.
Balancing Valves and the Throttling That Equalizes Flow
Balancing is achieved with valves that add adjustable resistance to over-flowing circuits, and the type of valve determines how well the balance holds as system load changes.
Balancing valve types:
Manual balancing valve / circuit setter: fixed adjustable resistance, set during commissioning
Automatic flow-limiting valve: caps flow at a setpoint regardless of pressure changes
PICV (pressure-independent control valve): holds flow independent of differential pressure,
  combining balancing and modulating control in one device
How manual balancing works:
Throttle the over-flowing circuit's valve to add resistance.
This lowers its flow to design AND raises pressure available to starved circuits.
One adjustment shifts the balance across all circuits (hydraulic interaction).
The interaction problem:
Throttling one circuit changes the pressure seen by all others.
Manual balancing uses the iterative proportional method:
  balance one pass, re-measure, re-adjust until the set converges.
TAB technicians work through circuits systematically.
Automatic and PICV advantages:
Automatic flow limiters: hold circuit flow as others change, reducing interaction.
PICV: flow independent of differential pressure; control-valve modulation
  does not unbalance the system. Higher cost, simpler commissioning, better part-load.
Glycol note: Glycol's higher viscosity shifts valve flow characteristics. Balance with the actual working fluid, not water-based assumptions. Cross-reference the Glycol Concentration article for the viscosity effect.
Per ASHRAE Handbook HVAC Systems and Equipment and manufacturers (IMI TA/Tour & Andersson, Danfoss, Belimo): manual circuit setters require iterative proportional balancing; automatic flow limiters cap flow at their setpoint; PICVs hold flow independent of differential pressure. Throttling over-flowing circuits restores distribution. PICVs hold balance across load; manual valves need re-balancing after system changes.
Valve Authority and the Differential Pressure Behind the Flow
The flow through a circuit depends not only on the valve position but on the differential pressure across it, and valve authority (the valve's share of the total circuit pressure drop) determines whether a control valve actually controls flow.
Differential pressure drives flow:
Flow ∝ √(differential pressure) through a given valve opening.
Change the differential pressure and the flow changes at the same valve position.
Valve authority defined:
Authority = valve pressure drop / total circuit pressure drop

High authority (> 0.5): valve controls flow well, its resistance dominates
Low authority (< 0.25): flow swings with system pressure, control is poor
Why authority matters: A control valve with low authority modulates poorly: small position changes cause large flow swings, or large changes cause almost no flow change. Good balancing combined with correct valve sizing gives adequate authority for stable control.
The load-shift effect:
As building load varies, control valves modulate, changing differential pressure
across all other circuits and unbalancing them from their commissioning set points.
PICVs hold flow independent of differential pressure, solving this.
Balancing sets the baseline:
Balancing establishes the design distribution at design conditions.
Valve authority and PICVs maintain it as conditions change.
This calculator's scope:
It checks the flow ratio at the measured condition.
It does not compute valve authority or differential pressure (Section 13).
Those are separate hydraulic design checks.
Per ASHRAE Handbook HVAC Systems and Equipment and valve manufacturers (Danfoss, Belimo, IMI TA): flow depends on differential pressure, not valve position alone. Valve authority (valve drop / total circuit drop, ideally above 0.5) sets whether a control valve controls flow. Load changes shift differential pressure and unbalance circuits; PICVs hold flow independent of it.
Measured, Not Estimated: Why Valve Position Is Not Flow
The actual flow entered into the calculator must come from a calibrated measurement, not from reading valve position, because the same valve position passes different flows depending on the differential pressure across it.
Why position misleads:
Flow ∝ √(differential pressure) at a fixed opening.
Differential pressure varies with system load, pump curve, and other circuits modulating.
A valve at a given position passes different flow under different conditions.
Position predicts flow only if the differential pressure is known and constant.
Measurement methods:
Ultrasonic flow meter: clamp-on, non-invasive, measures actual flow velocity
Orifice plate / venturi: pressure drop across a known restriction converts to flow
Circuit setter with pressure taps: measures differential pressure,
  converts to flow via the valve's Cv (flow coefficient)
The commissioning requirement:
AABC National Standards and NEBB Procedural Standards require measured flow
from a calibrated instrument.
Estimating from valve position or pump speed is not acceptable for sign-off.
Measurement error propagates:
The flow ratio is only as good as the actual-flow measurement.
Instrument accuracy, placement, and calibration all affect the result.
A poorly measured circuit can appear balanced when it is not.
Note the measurement uncertainty before relying on the ratio.
Enter actual flow in the same unit as design (both GPM or both L/s). Always measure with a calibrated instrument; verify the measurement basis before trusting the ratio output.
Per AABC National Standards for Total System Balance and NEBB Procedural Standards for Testing and Balancing: actual flow must be measured with a calibrated instrument, not estimated from valve position or pump speed, because flow depends on differential pressure at a given opening. Measurement error propagates directly to the flow ratio.
Worked Example: 9.2 Against 10 GPM at a 0.92 Flow Ratio
A heating coil circuit is measured during commissioning. Actual flow 9.2 GPM (0.580 L/s), design flow 10.0 GPM (0.631 L/s).
Step 1. Flow ratio:
flow_ratio = 9.2 / 10.0 = 0.92
Step 2. Flow deviation:
flow_deviation = ((9.2 − 10.0) / 10.0) × 100 = −8%
Step 3. Classification:
0.92 falls in 0.85–0.95 range: LOW / MARGINAL
Step 4. Interpretation:
The circuit delivers 92% of design flow, 8% short.
Below the 0.95–1.05 recommended band, not severely (not below 0.85),
but outside the acceptable tolerance.
Step 5. Capacity impact:
8% underflow reduces the coil's heating delivery.
Capacity falls less than proportionally to flow (due to the coil curve),
but a mild comfort shortfall in the served zone is likely at design conditions.
Step 6. What to check:
Valve position: is the balancing valve set too far throttled?
Differential pressure: is enough pressure available at this circuit?
Circuit resistance: fouling, trapped air, or a partially closed isolation valve?
Step 7. The likely fix:
If other circuits are over-flowing (stealing flow), throttle them first
to free pressure for this starved circuit.
Or open this circuit's balancing valve slightly if margin allows.
Re-measure after any adjustment; balancing is iterative.
Step 8. Metric equivalence:
9.2 GPM = 0.580 L/s; 10.0 GPM = 0.631 L/s
0.580 / 0.631 = 0.92 (same ratio, dimensionless regardless of unit)
Step 9. Not yet sign-off:
0.92 is LOW/MARGINAL, outside the recommended band.
Adjust and re-measure to reach 0.95–1.05 before balancing sign-off.
This is a screening check, not a final TAB sign-off.
Result: Flow ratio 0.92, deviation −8%, LOW/MARGINAL. Circuit underflowing. Check valve position, differential pressure, and circuit resistance. Throttle over-flowing neighbor circuits to free pressure. Re-measure and bring within 0.95–1.05 for acceptance. If this is a glycol loop, verify with the actual glycol fluid (higher viscosity shifts flow characteristics). Cross-reference the Liquid Cooling Flow Rate article for the total loop flow this circuit draws from.
Balanced and Overflow Worked Examples
Balanced case (Metric example).
Near-target flow: actual 0.63 L/s, design 0.60 L/s.
flow_ratio = 0.63 / 0.60 = 1.05
deviation  = ((0.63 − 0.60) / 0.60) × 100 = +5%
Classification:
1.05 falls at the top of the 0.95–1.05 range: RECOMMENDED
Interpretation: 5% over design, at the edge of the acceptable band. Balanced for commissioning purposes (within ±5%). Slightly high, acceptable but near the boundary.
Boundary note:
1.05 is the inclusive top of RECOMMENDED; 1.06 would be HIGH.
A circuit right at the edge may drift out with load changes.
Note it in the commissioning record for follow-up.
Overflow case (Imperial example).
Significant over-flow: actual 12.4 GPM (0.782 L/s), design 10.0 GPM (0.631 L/s).
flow_ratio = 12.4 / 10.0 = 1.24
deviation  = ((12.4 − 10.0) / 10.0) × 100 = +24%
Classification:
1.24 > 1.15: TOO HIGH
Interpretation: 24% over design, significant overflow. This circuit is stealing flow, wasting pump energy, and reducing the available pressure for starved circuits.
The fix:
Throttle this circuit's balancing valve to bring flow toward 1.00.
This frees pressure for starved circuits downstream.
Re-measure the full set after adjustment (interaction).
The system view:
An overflowing circuit (1.24) and an underflowing one (0.92) are often
two sides of the same imbalance.
Throttling the greedy one helps the starved one.
Balance the set together, not in isolation.
Results: Metric 0.63/0.60: ratio 1.05, +5%, RECOMMENDED (at the band edge). Imperial 12.4/10.0: ratio 1.24, +24%, TOO HIGH. Throttle the over-flowing circuit, re-measure, and bring the full set within 0.95–1.05.
Per TAB practice (AABC/NEBB): the balanced case at 1.05 is acceptable, at the band edge. The overflow at 1.24 (+24%, TOO HIGH) steals flow from other circuits; throttle it and re-measure. Overflow and underflow are frequently two sides of the same imbalance; balance the set together.
Application Boundaries: Capacity, Cause, Differential Pressure, TAB Sign-Off
Actual Capacity Delivered. The flow ratio checks flow, not the heating or cooling capacity delivered. Capacity depends on flow and supply temperature, ΔT, and coil condition. A flow-balanced circuit with the wrong supply temperature still under-delivers. Verify capacity separately (cross-reference HVAC Delta T Calculator).
Physical Cause of Imbalance. Identifies that a circuit is off-target, not the reason why. The cause (valve position, differential pressure, fouling, trapped air, partially closed isolation valve) needs field investigation beyond the ratio screen.
Differential Pressure and Valve Authority. Does not compute differential pressure, valve authority, or pump head. Those are separate hydraulic design checks covered in Section 9 above.
Multi-Circuit Interaction. Checks one circuit at a time. Balancing one circuit shifts the pressure seen by all others (Section 8). Whole-system balancing is iterative, beyond the scope of a single ratio check.
Control-Valve Modulation. Assumes a measured steady flow at a point in time. Modulating control valves change flow continuously. PICVs hold flow at setpoint. Dynamic behavior under varying load is separate from this screening.
Measurement Accuracy. The ratio is only as accurate as the measured actual flow (Section 10). Instrument error propagates directly to the ratio result and to the classification tier.
Temperature and ΔT Verification. Does not check supply or return temperatures or the ΔT. A circuit can be flow-balanced but thermally off (wrong ΔT, cross-reference HVAC Delta T Calculator for thermal verification).
Glycol and Fluid Properties. Flow measurement instrument readings and valve flow characteristics both shift with glycol viscosity. Balance with the actual working fluid, not water assumptions (cross-reference Glycol Concentration Calculator).
Direct versus Reverse Return. Does not model the return topology, which affects the baseline imbalance before valves are adjusted (Section 7).
TAB Sign-Off. This is a screening tool, not a TAB acceptance record. Sign-off requires measured flows from calibrated instruments, valve commissioning records, differential pressure data, and project-specific acceptance criteria per AABC National Standards, NEBB Procedural Standards, and the commissioning plan developed under ASHRAE Guideline 0 and ASHRAE Guideline 1.1.
Per ASHRAE Guideline 0 (The Commissioning Process), ASHRAE Guideline 1.1 (HVAC&R Technical Requirements for the Commissioning Process), AABC National Standards for Total System Balance, and NEBB Procedural Standards for Testing and Balancing: single-circuit flow-ratio screening is the calculator scope. Delivered capacity, the physical cause, differential pressure, valve authority, multi-circuit interaction, control-valve modulation, ΔT verification, glycol fluid effects, and formal TAB sign-off require separate analysis. A qualified TAB technician commissions and signs off the balanced system.
Hydronic Balancing Calculator
Open Hydronic Balancing Calculator
Hydronic balancing by flow ratio: divides a circuit's measured flow by its design flow for the flow ratio, expresses the gap as a deviation percent, then classifies the result against the 0.95 to 1.05 commissioning band. Checks whether a circuit is underflowing, balanced, or overpumping relative to its design intent, in GPM or L/s. Enter measured flow from a calibrated instrument, not valve position. A balancing screen, not a TAB sign-off.
Open Hydronic Balancing CalculatorFAQ
How do you calculate hydronic balance?
Per TAB practice (AABC/NEBB): divide the circuit's measured actual flow by its design flow for the flow ratio (1.00 is perfect), then compute the deviation percent as ((actual − design) / design) × 100. A ratio in 0.95–1.05 is balanced within the standard ±5% commissioning tolerance. Enter both values in the same unit; the ratio is dimensionless.
What is an acceptable flow ratio for a balanced hydronic circuit?
Per ASHRAE Handbook HVAC Systems and Equipment and commissioning practice: 0.95 to 1.05, a ±5% tolerance around design flow. Below 0.85 is significant underflow (lost heating or cooling capacity); above 1.15 is significant overflow (wasted pump energy, starved circuits). Project specifications may set different acceptance criteria.
Why do some circuits get too much flow and others too little?
Per ASHRAE Fundamentals (fluid flow): water follows the path of least resistance, so low-resistance circuits near the pump over-flow while high-resistance circuits at the far end starve, even when the pump delivers the correct total. This flow stealing is the fundamental reason balancing valves are required, even in correctly sized systems.
How is a hydronic circuit balanced?
Per ASHRAE Handbook HVAC Systems and Equipment: by throttling the over-flowing circuits with balancing valves, adding resistance to lower their flow and freeing pressure for starved circuits. Manual circuit setters balance iteratively using the proportional method; PICVs (pressure-independent control valves) hold flow independent of differential pressure without iterative re-adjustment.
Why can't I just read flow from the valve position?
Per AABC National Standards and NEBB Procedural Standards: because flow depends on the differential pressure across the valve, not just its opening position. The same valve position passes different flows as system load and pressure change. Measure with a calibrated instrument (ultrasonic meter, orifice plate, circuit setter); valve position is not an acceptable substitute for commissioning sign-off.
What is valve authority in a hydronic system?
Per ASHRAE Handbook HVAC Systems and Equipment: the valve's share of the total circuit pressure drop (valve pressure drop divided by total circuit pressure drop). Above roughly 0.5, the valve controls flow reliably; below 0.25, flow swings with system pressure changes and control is poor. Low authority undermines both balancing stability and control valve performance.
Does a balanced flow mean the terminal delivers its rated capacity?
Per ASHRAE Handbook HVAC Systems and Equipment: not by itself. Capacity depends on flow and supply temperature, ΔT, and coil condition. A flow-balanced circuit with the wrong supply temperature, an undersized coil, or fouled heat-transfer surface still under-delivers. Flow balance is necessary but not sufficient; verify thermal performance separately using ΔT measurements.
Related Calculators
- Glycol Concentration Calculator: The fluid whose flow this balancing distributes across circuits (article).
- Liquid Cooling Flow Rate Calculator: The total loop flow that each circuit draws its share from (article).
- HVAC Delta T Calculator: The temperature difference that, with flow, sets delivered capacity.
- District Heating Pipe Loss Calculator: Heat loss in the buried distribution the balanced flow travels.
- Heat Exchanger Calculator: Terminal heat transfer the balanced flow feeds.
- Boiler Feed Pump Sizing Calculator: Pump sizing for the balanced heating loop.
- Boiler Efficiency Calculator: Plant efficiency behind the hydronic system.
- HVAC Heat Load Calculator: The load setting each terminal's design flow.